Did you know this site's responsive? (try resizing this page)
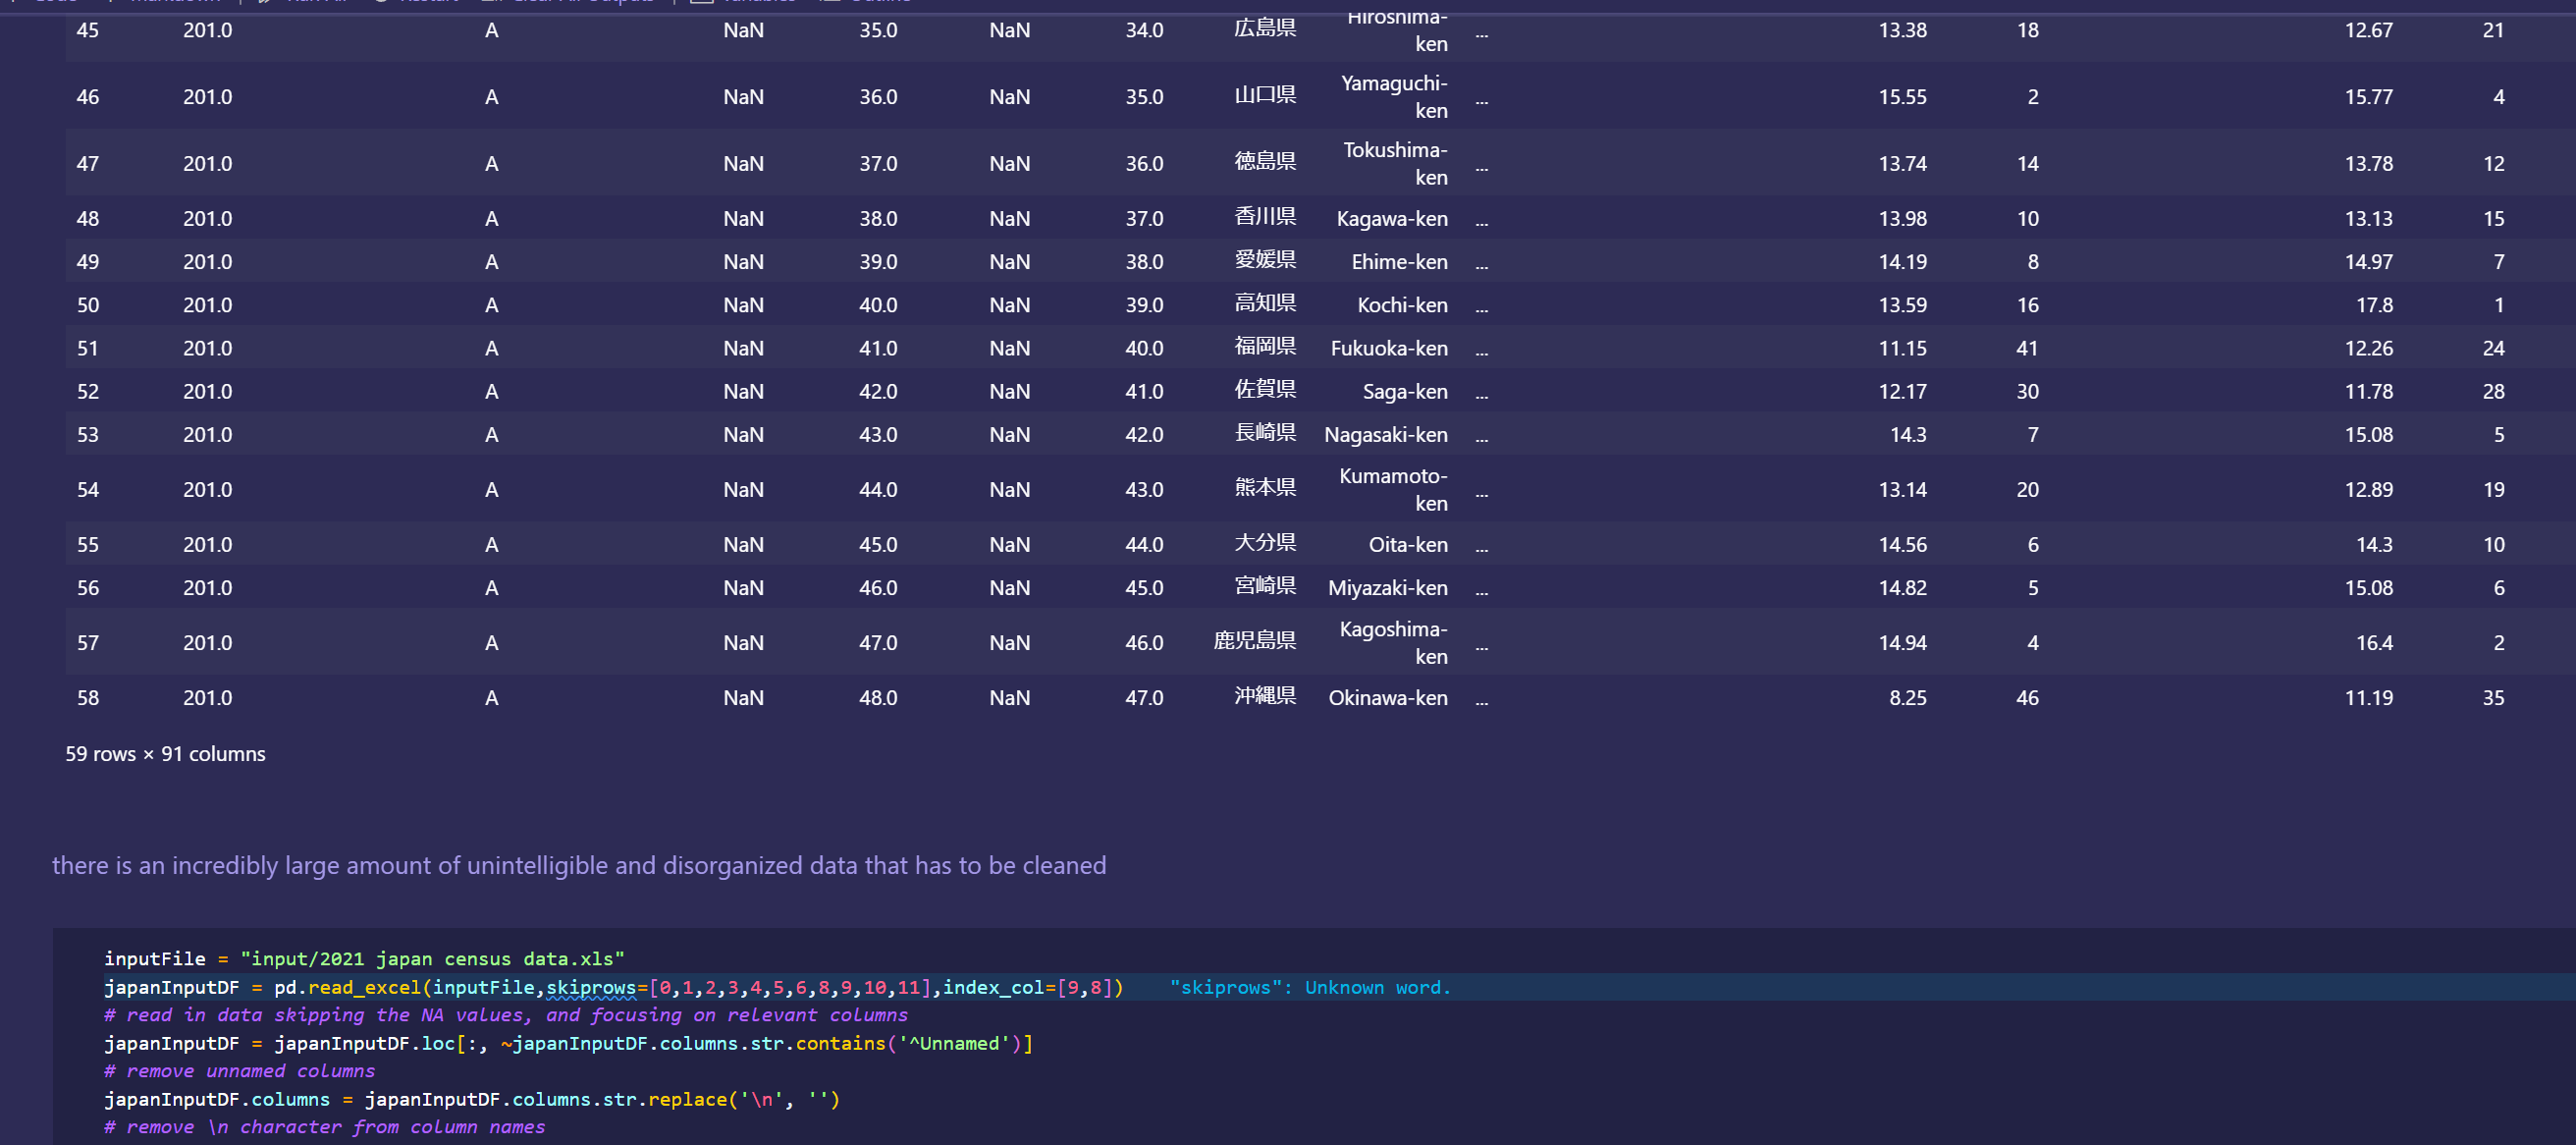
initial dataset preprocessing and cleaning (wrote python script/ jupyter notebook to do preliminary cleaning)
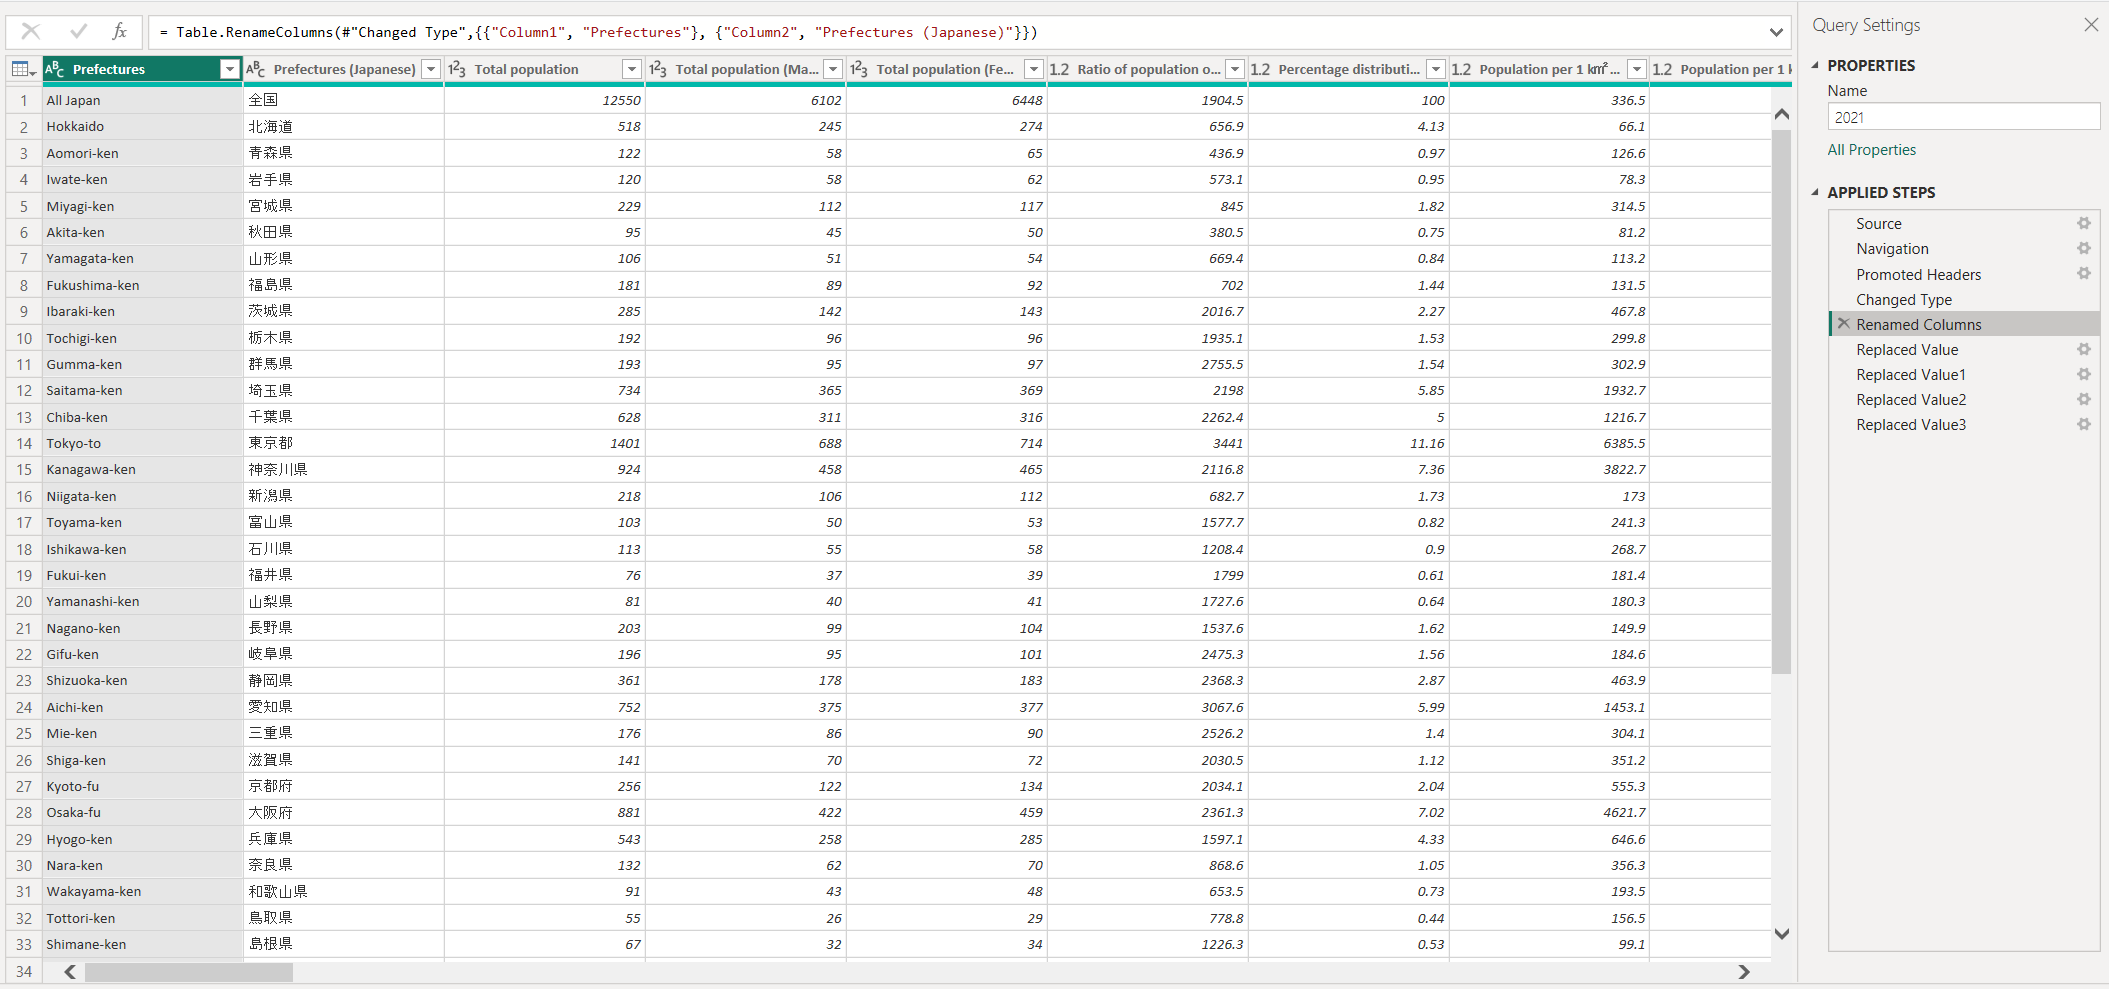
Secondary transformations and fixes done in PowerBI Query Editor
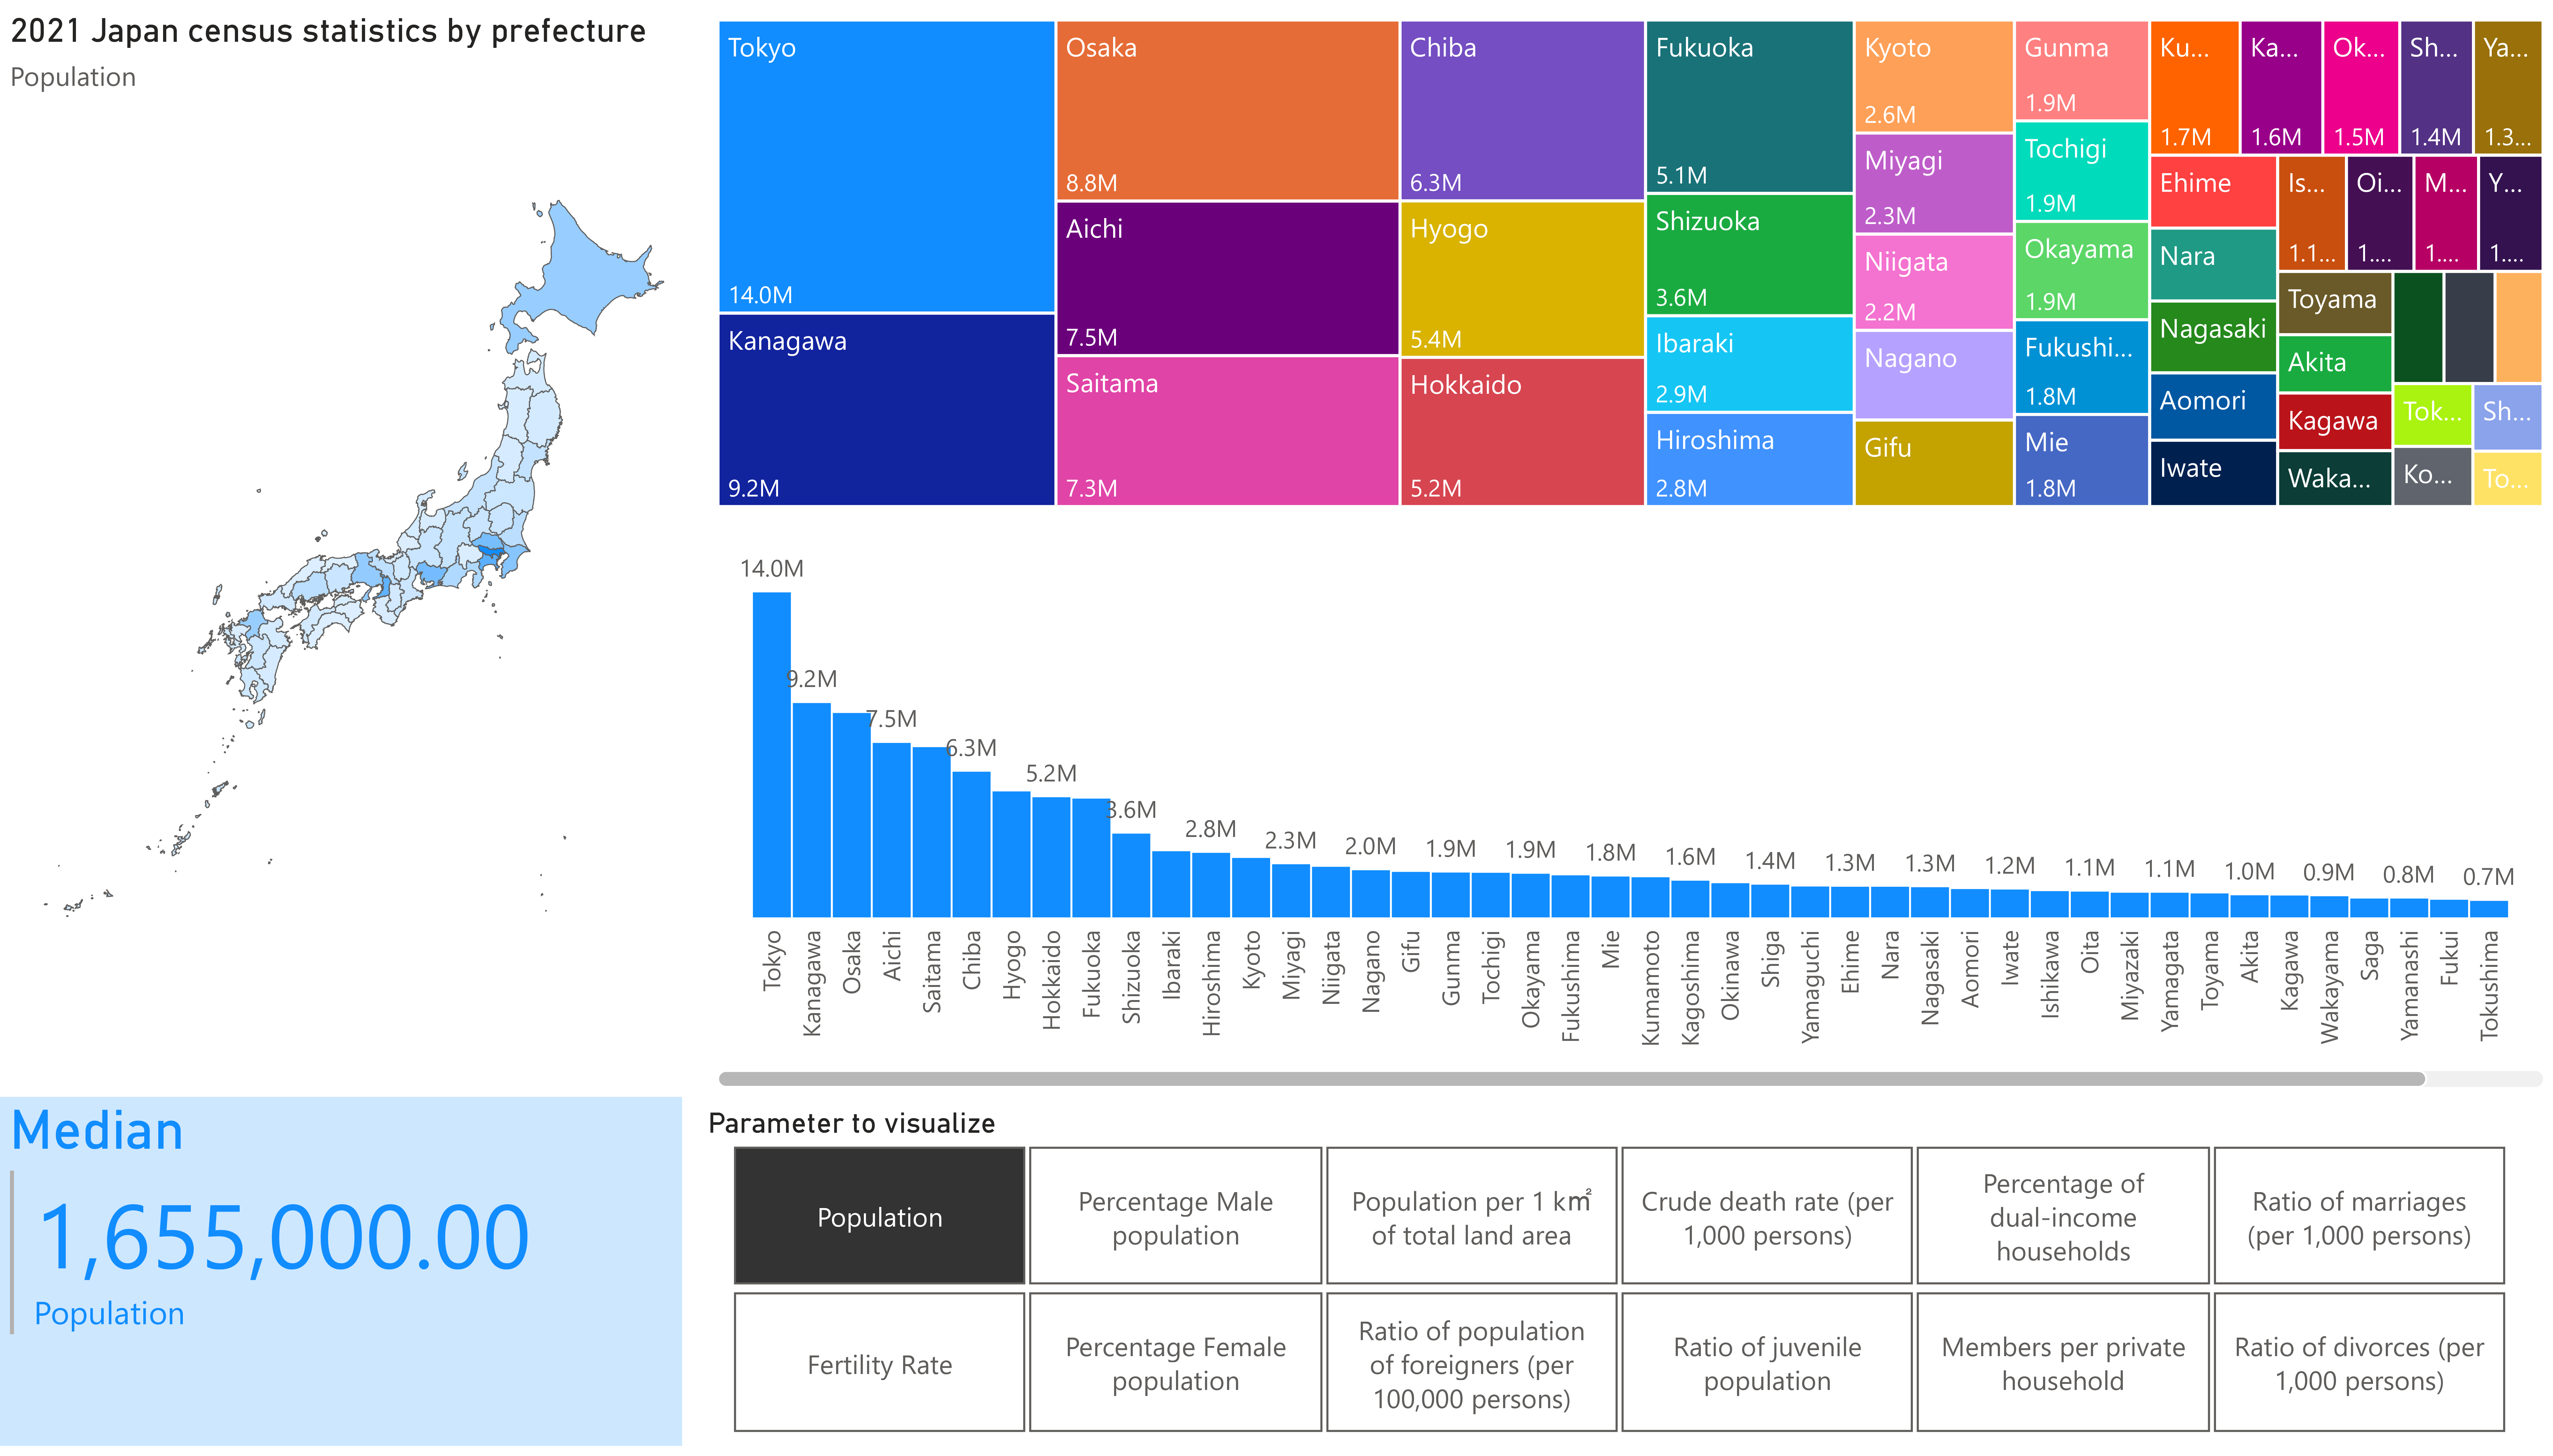
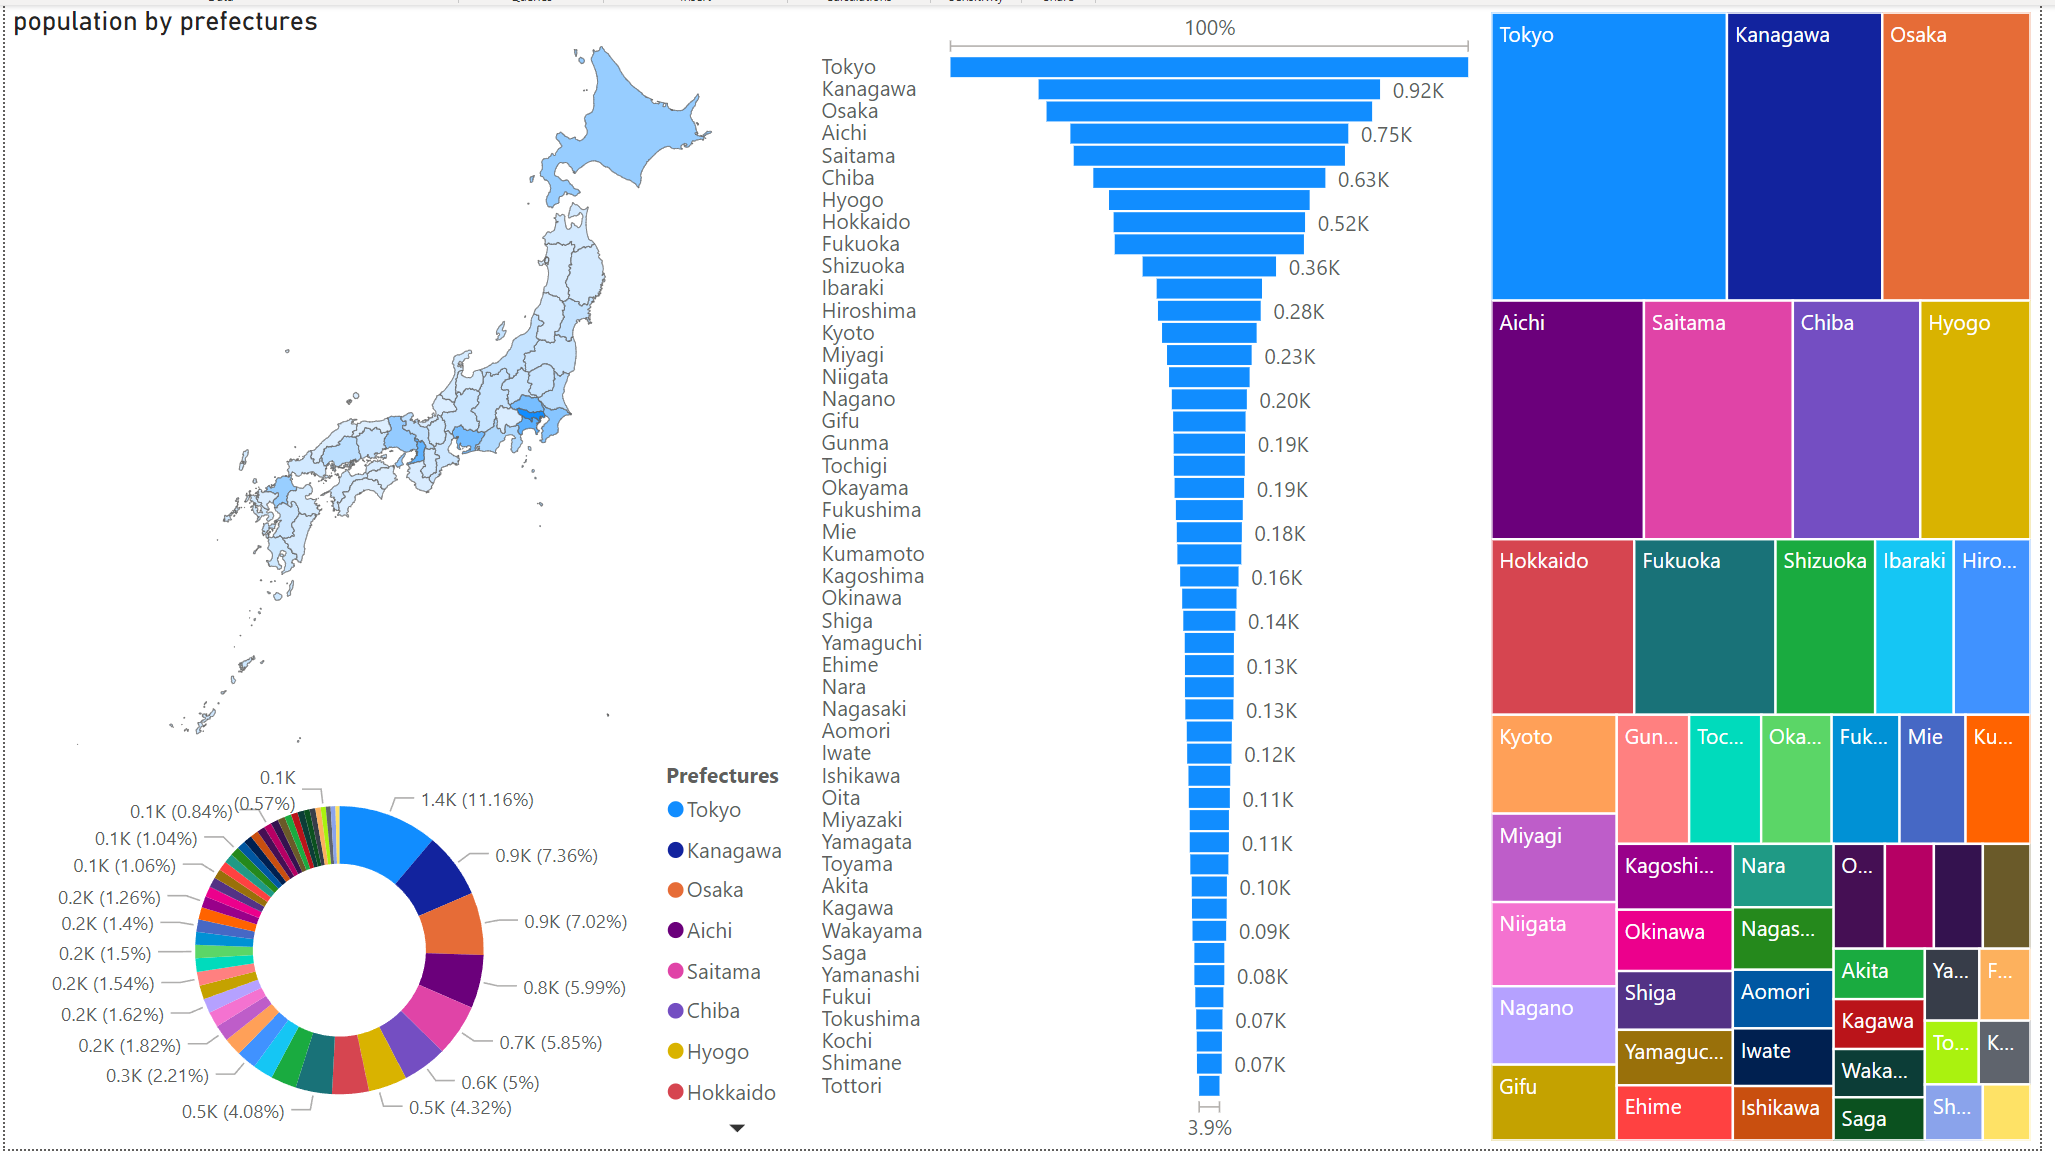
Rudimentary primary dashboard done based on population
DAX used for field parameter selection in dashboard
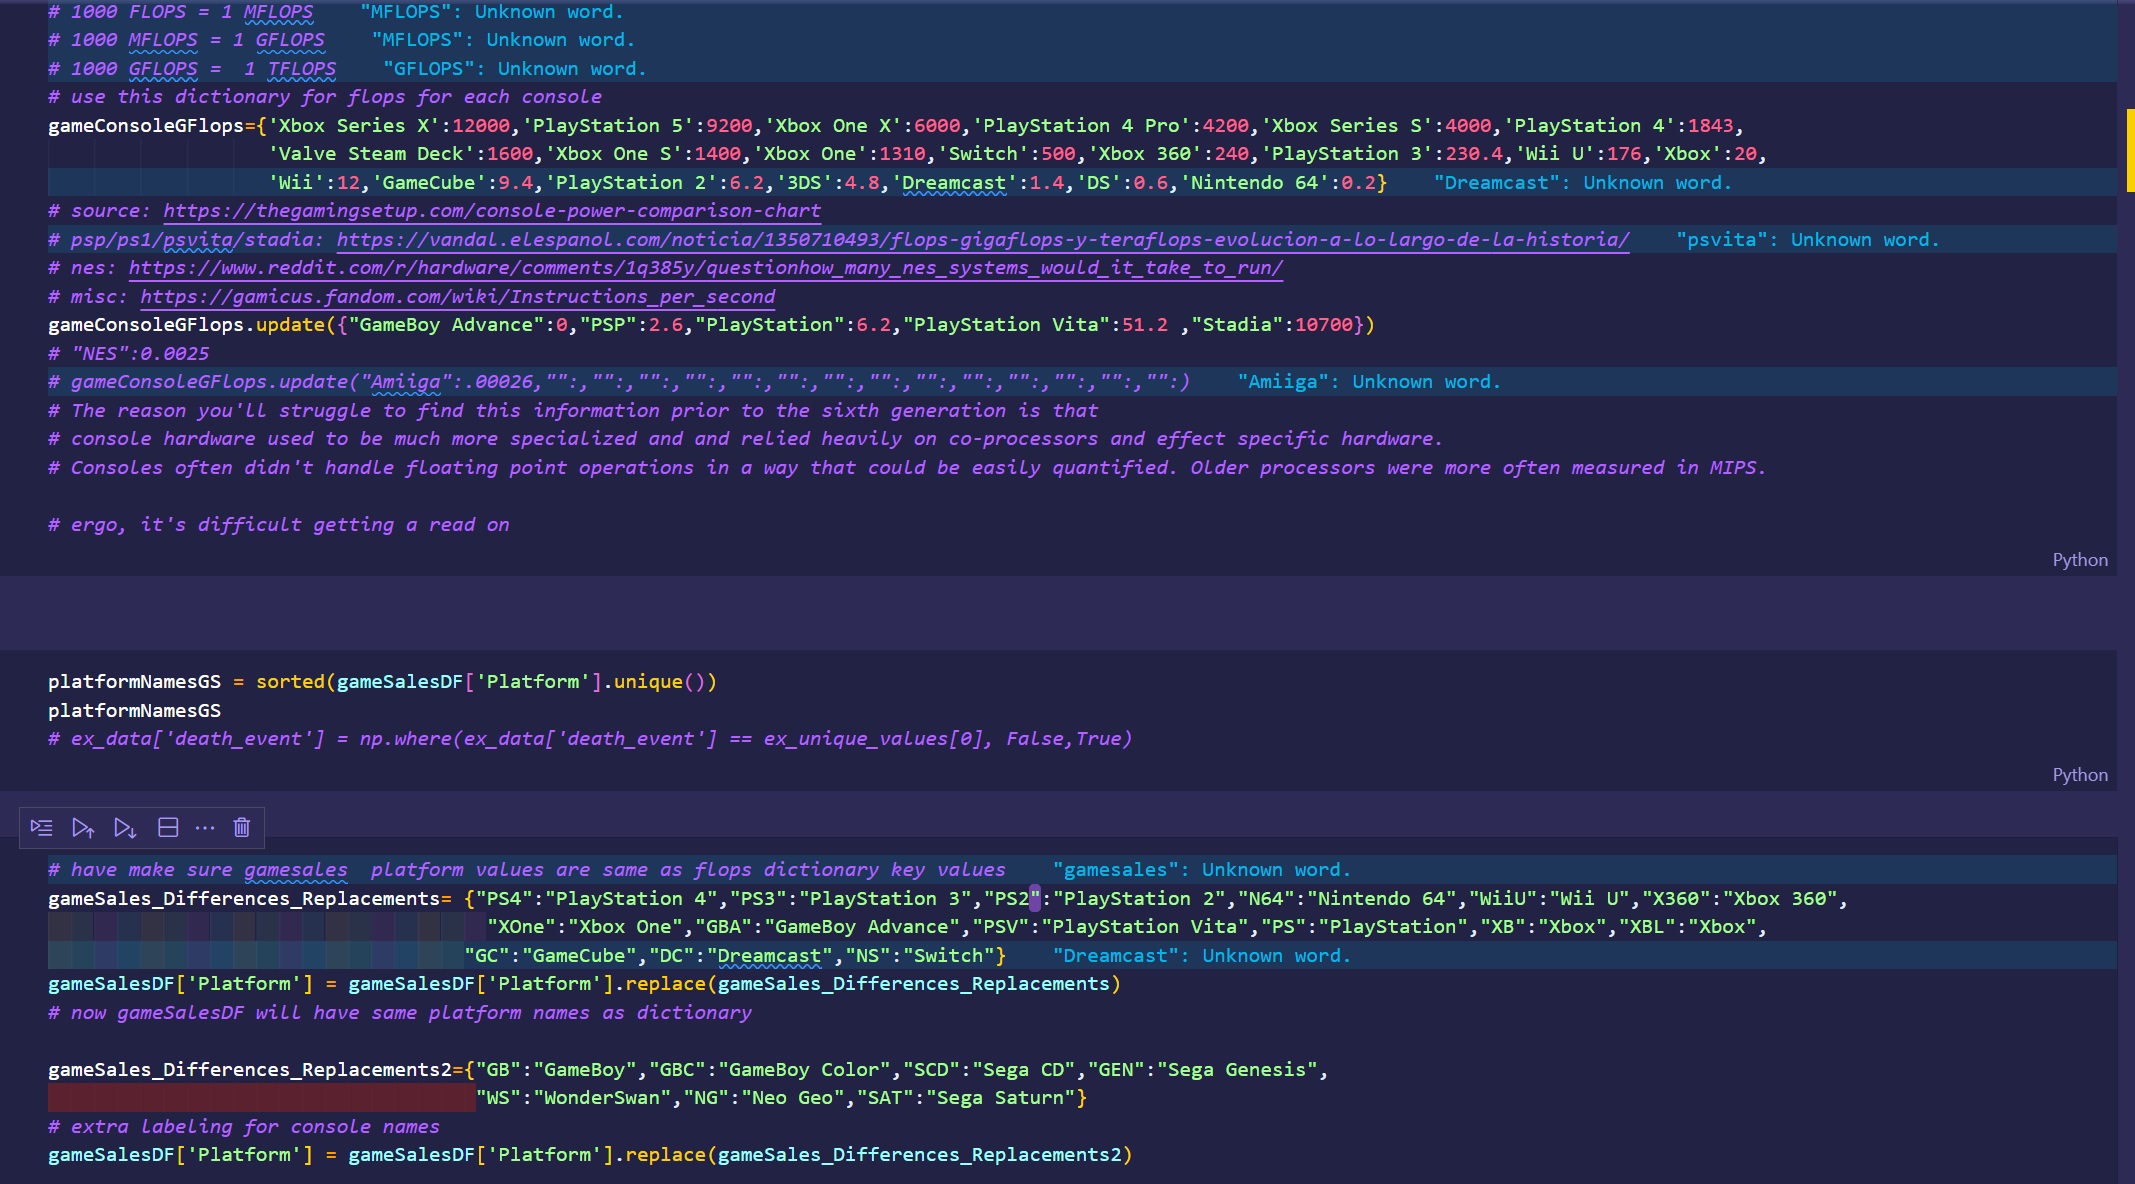
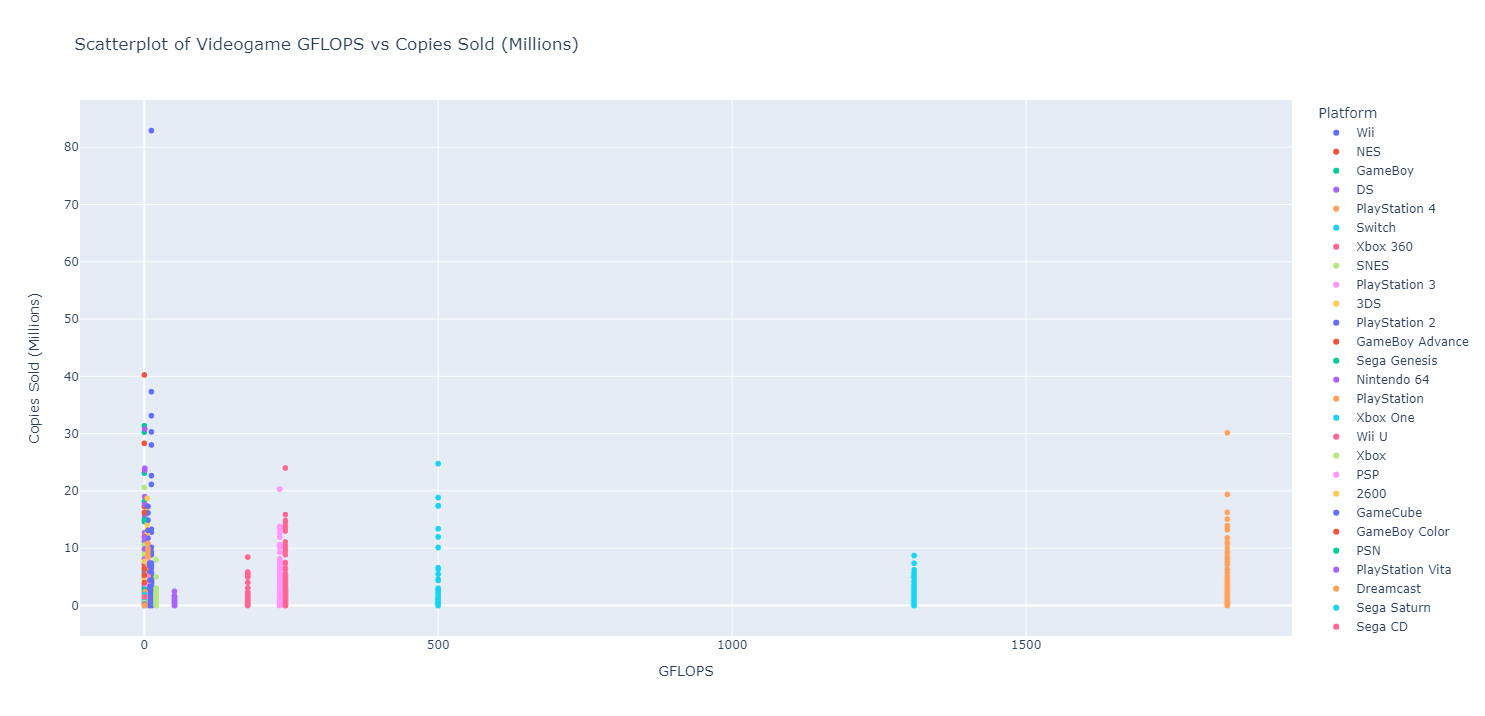
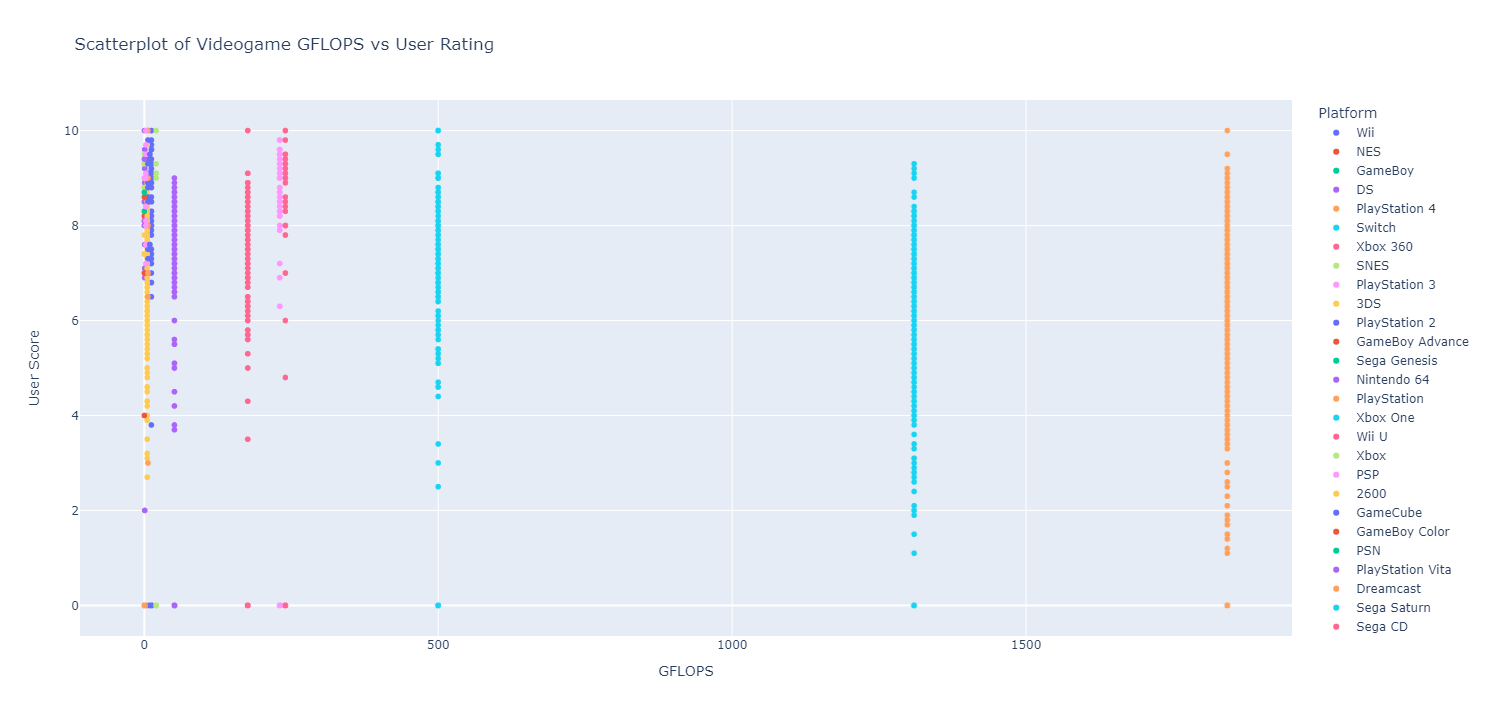
dataset preprocessing and cleaning (had to map console power with respective Gigaflops to dataset)
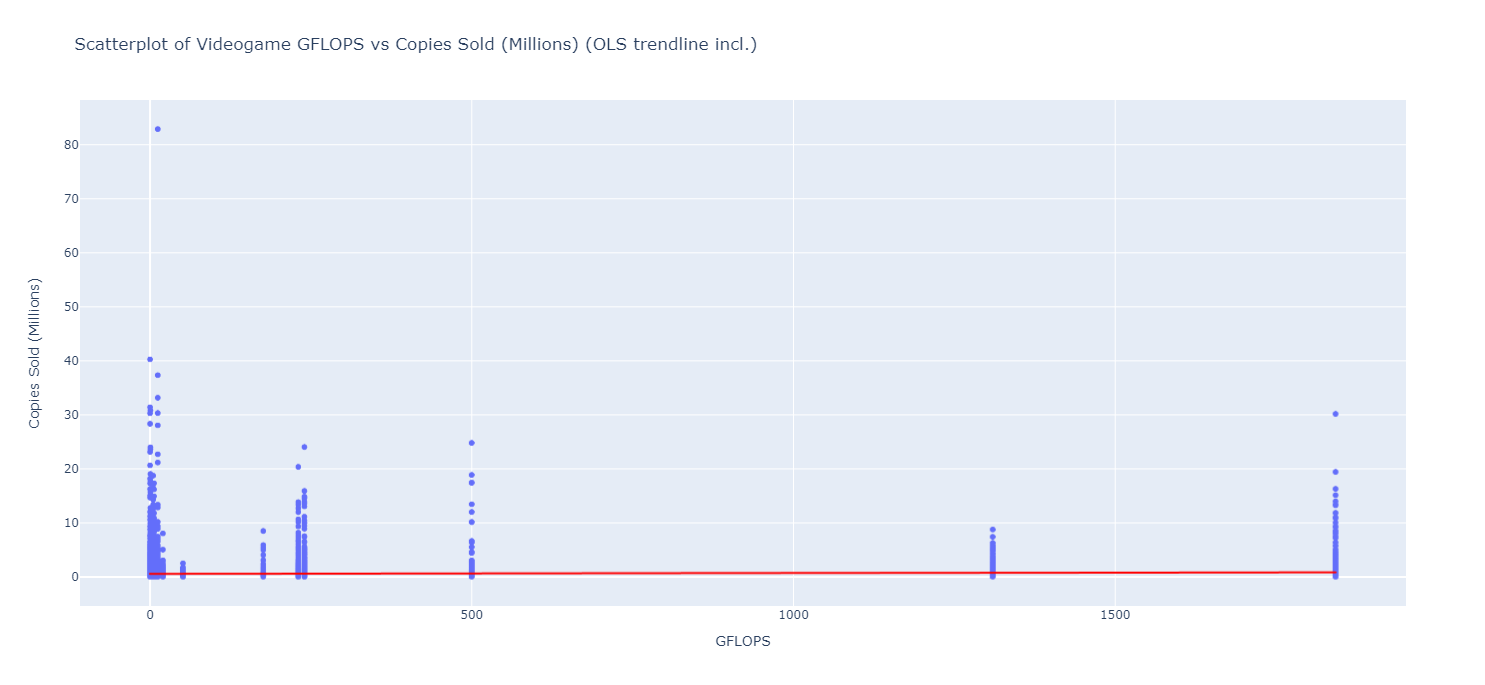
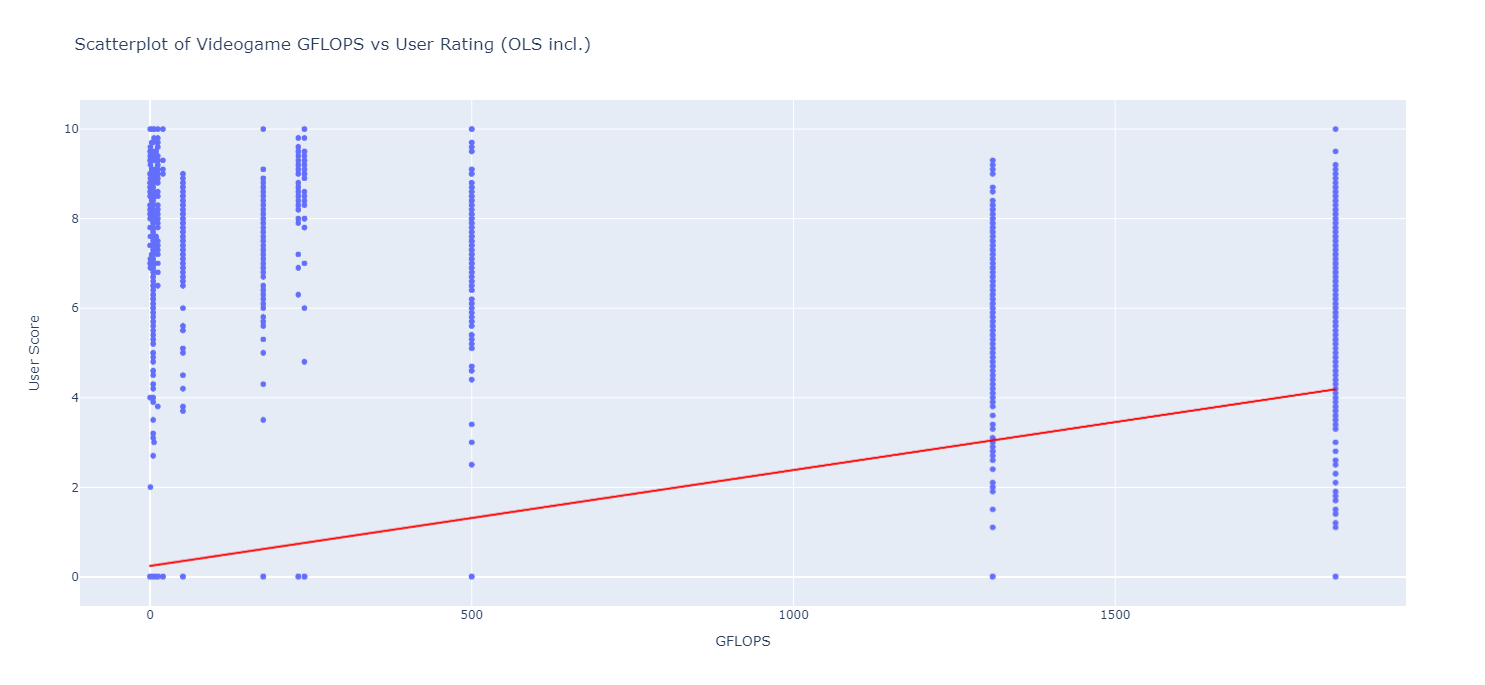
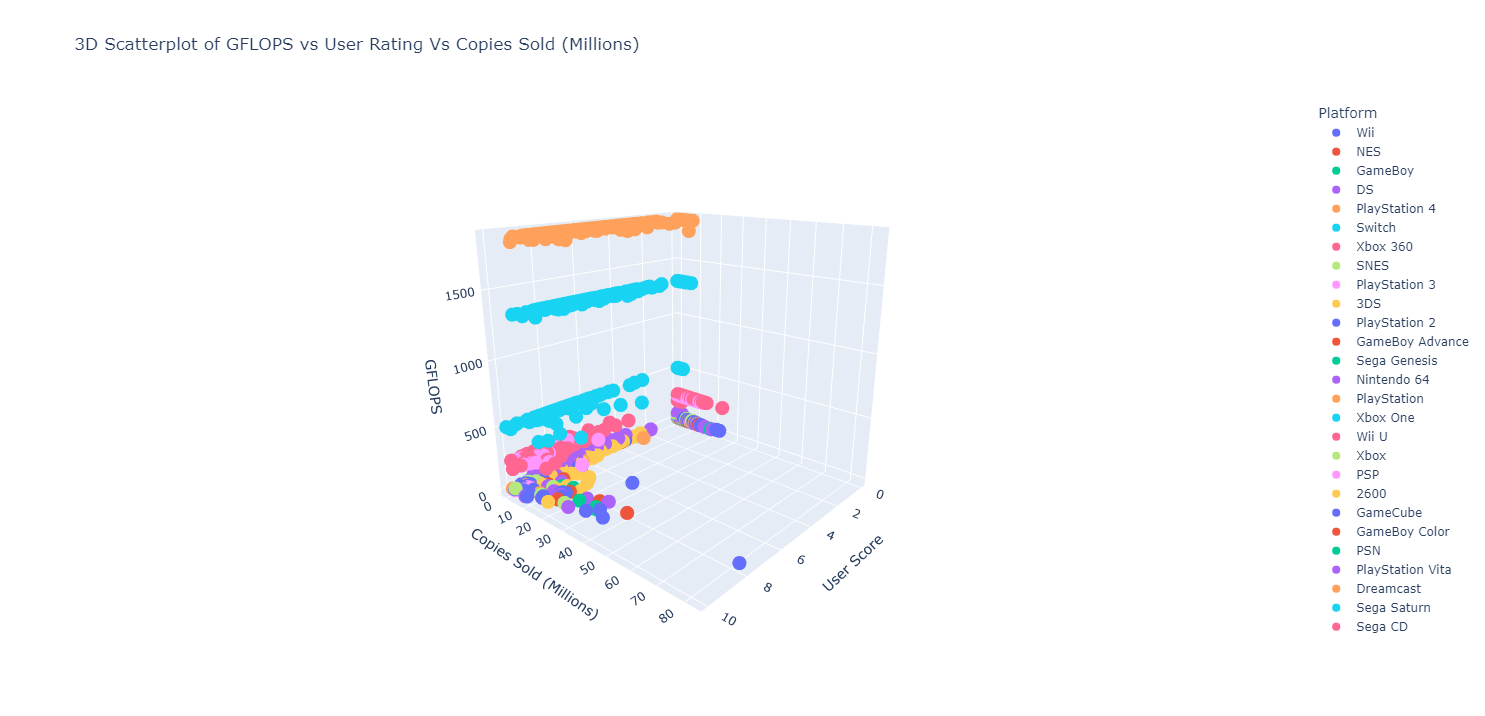
click image to open interactive plot of data in new tab (can hover over individual points to see specifics)
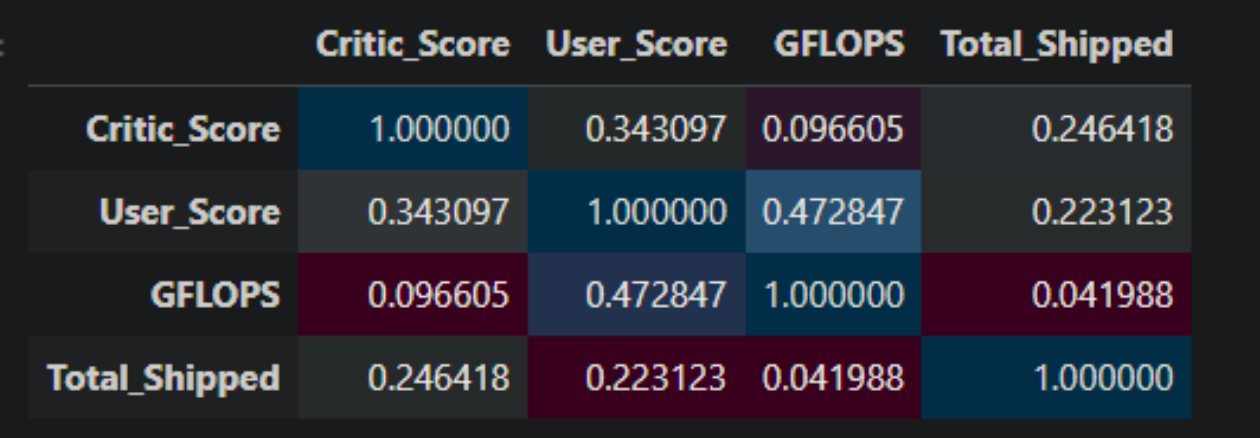
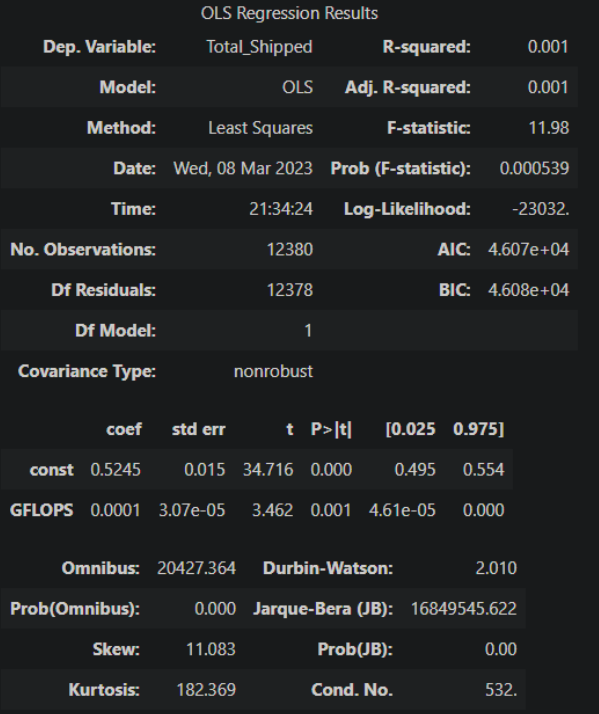
From the Linear regression, correlation plot interpretation and subsequent graphs, we can see there's hardly any covariance/correlation from video game graphics level (represented as GFLOPS) and its success (represented as total sales)
Finalized Plotly 3d scatterplot
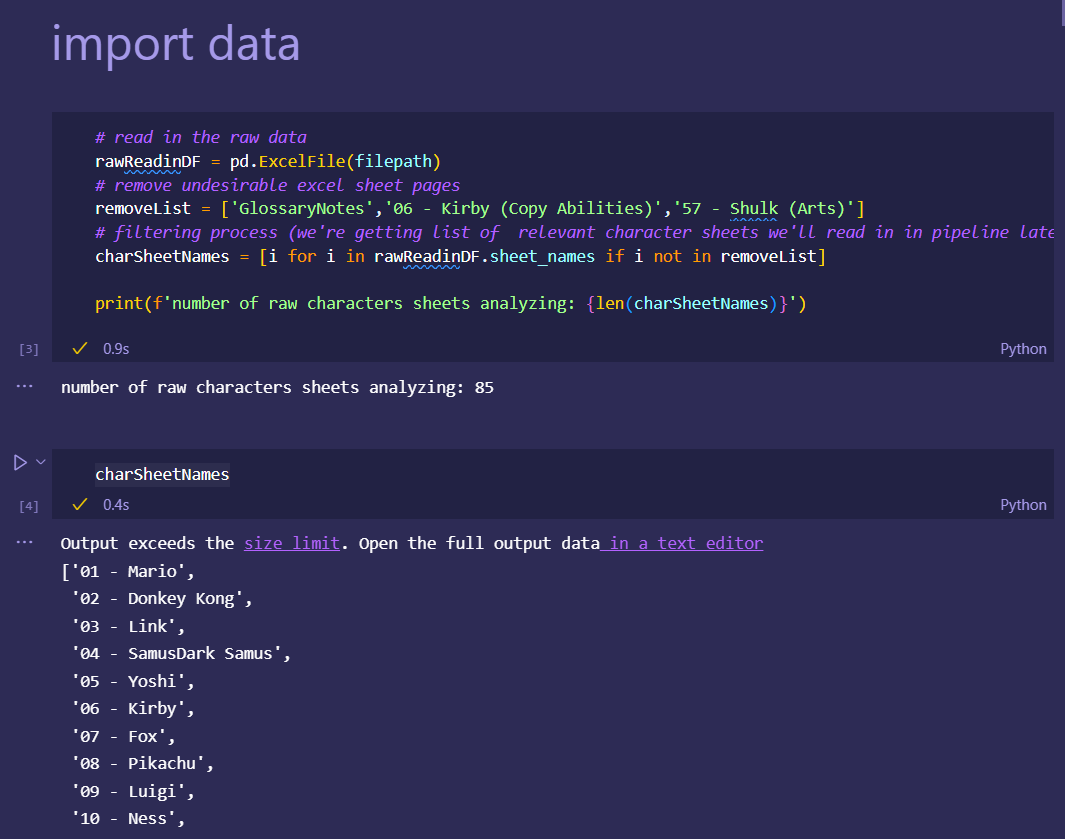
Preperation of reading in data...
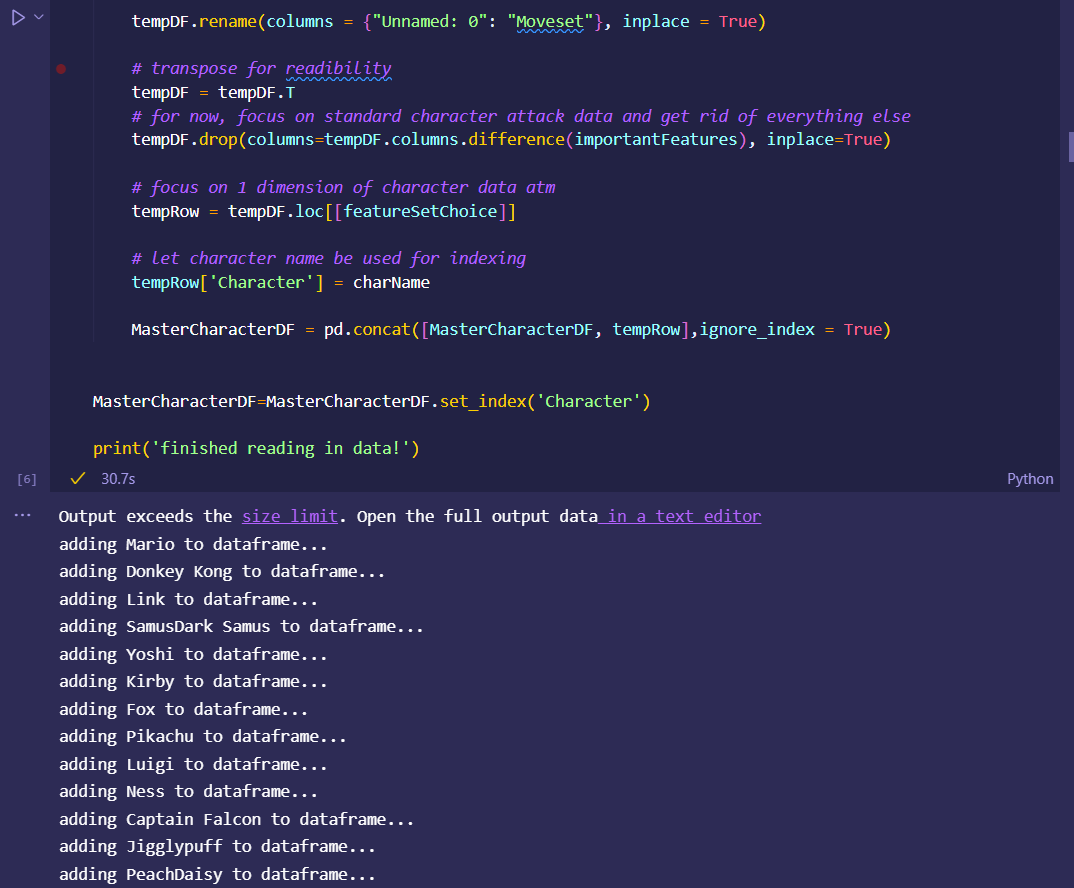
Pipeline for reading the datamined excel data into pandas dataframe
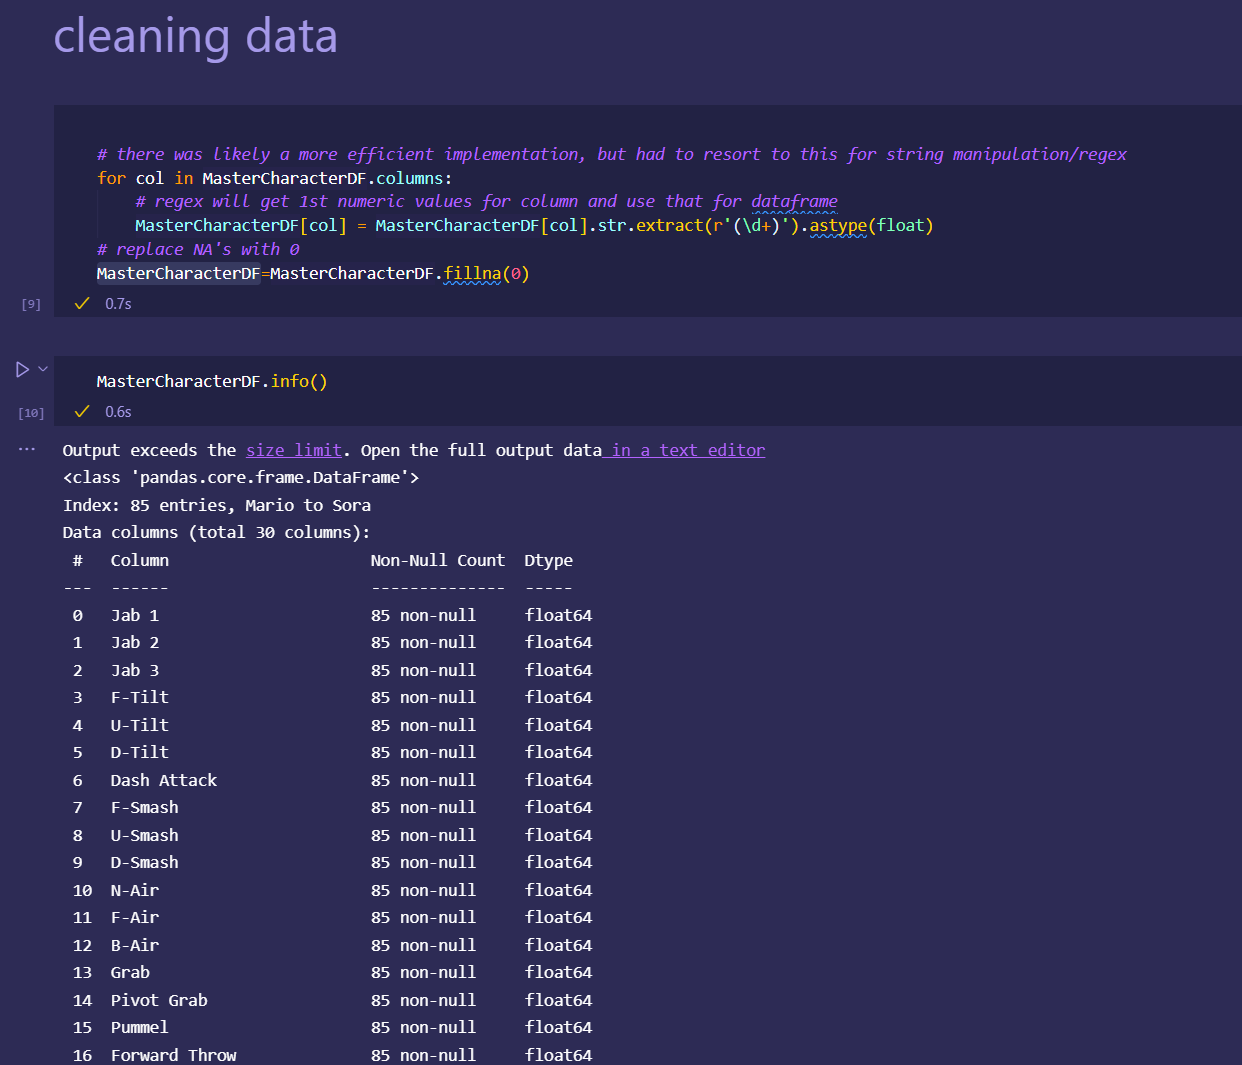
Cleaning data with regex for extracting and converting raw numeric values and aligning column data types
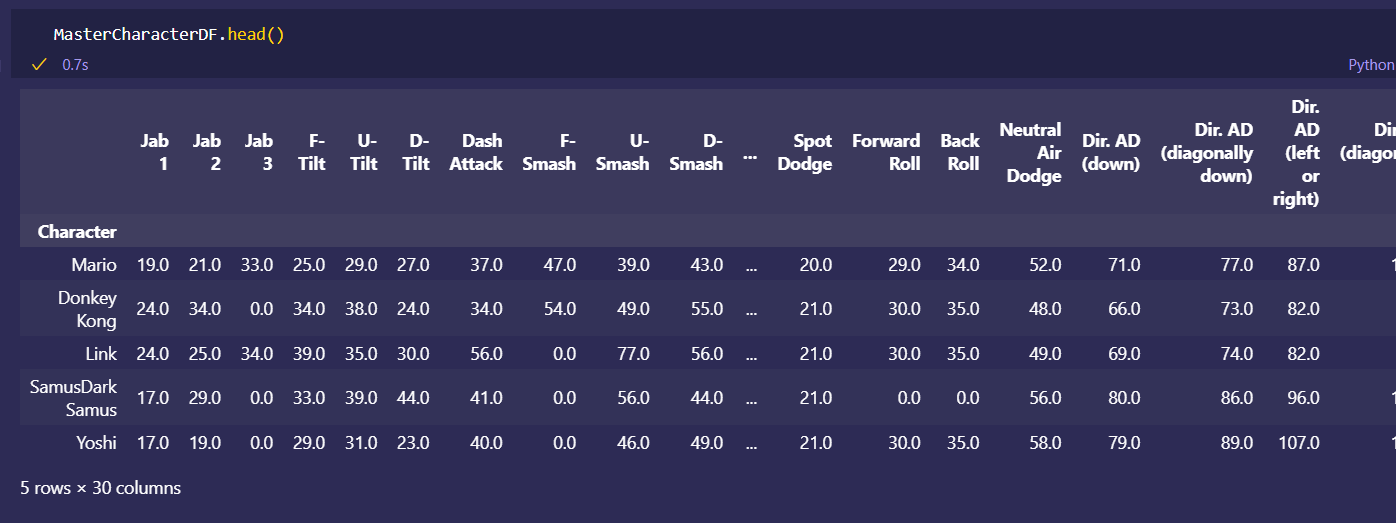
The now processed and cleaned data that's ready to be analyzed
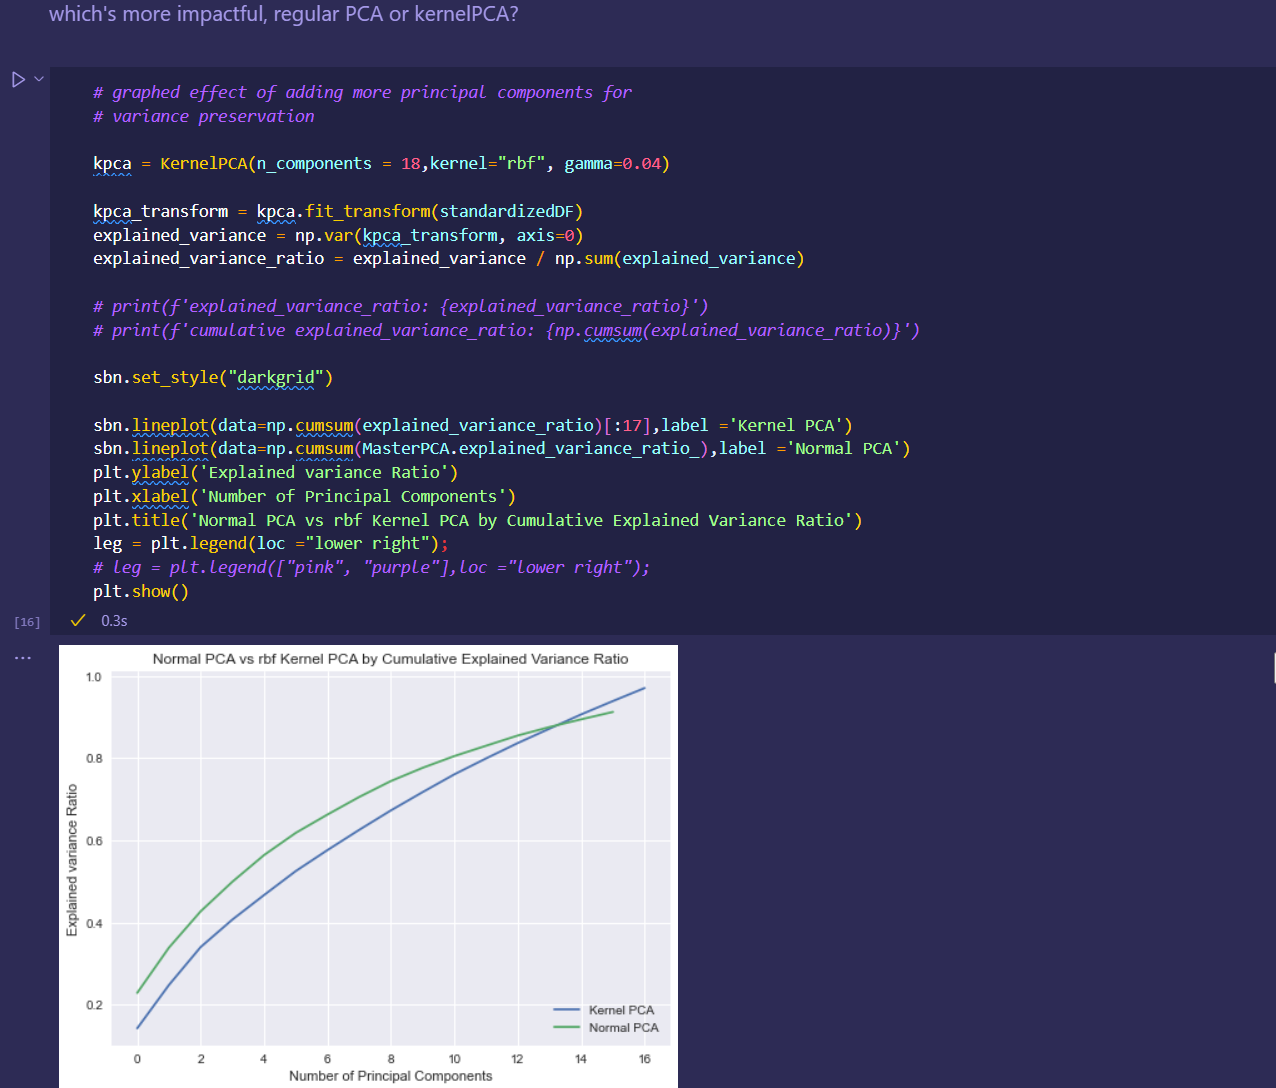
Quick comparison of whether standard PCA or Kernel type would be more efficient for lowering data dimensionality
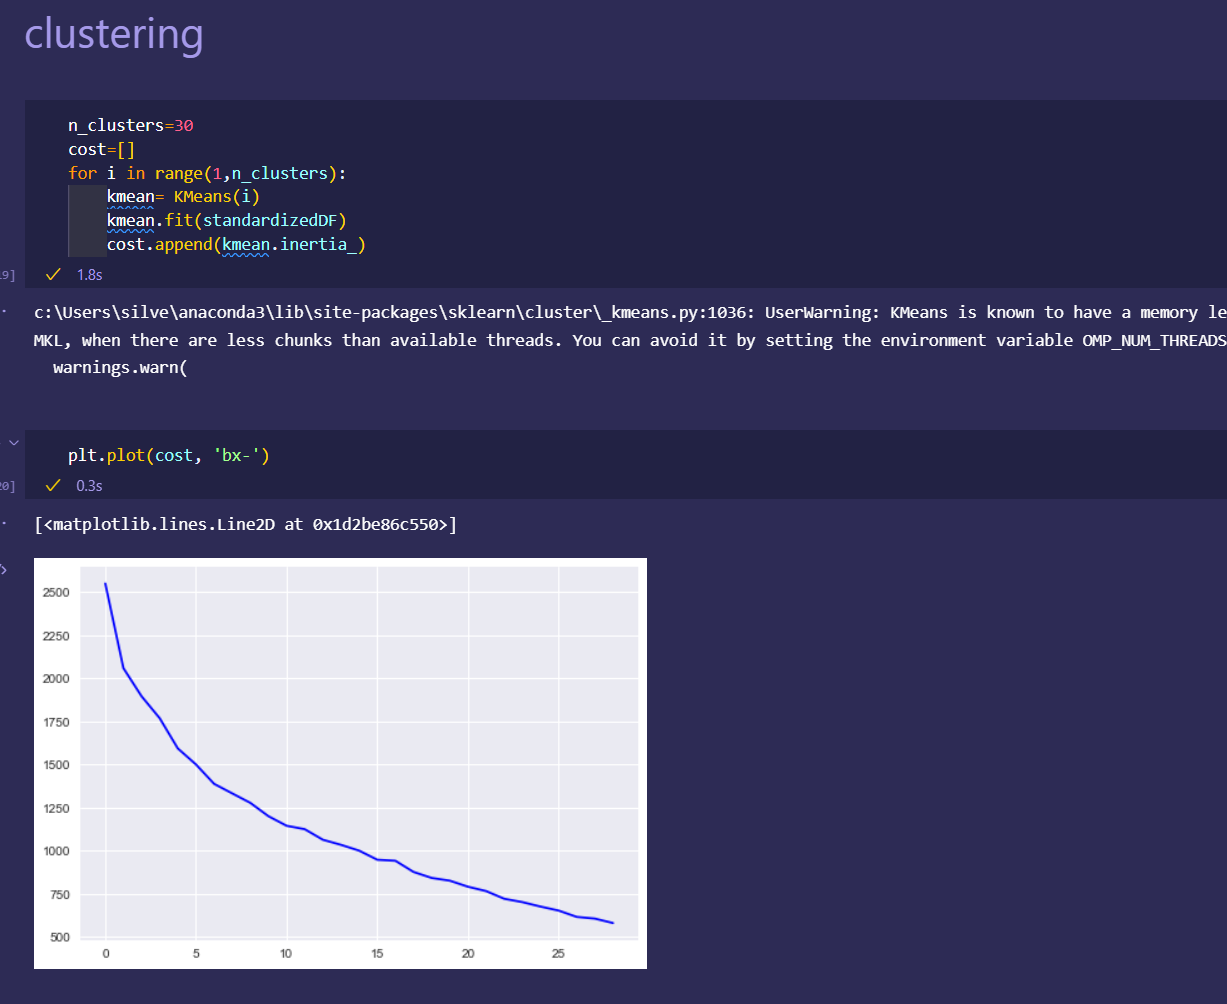
Quick check for optimal number of clusters to use in model going forward
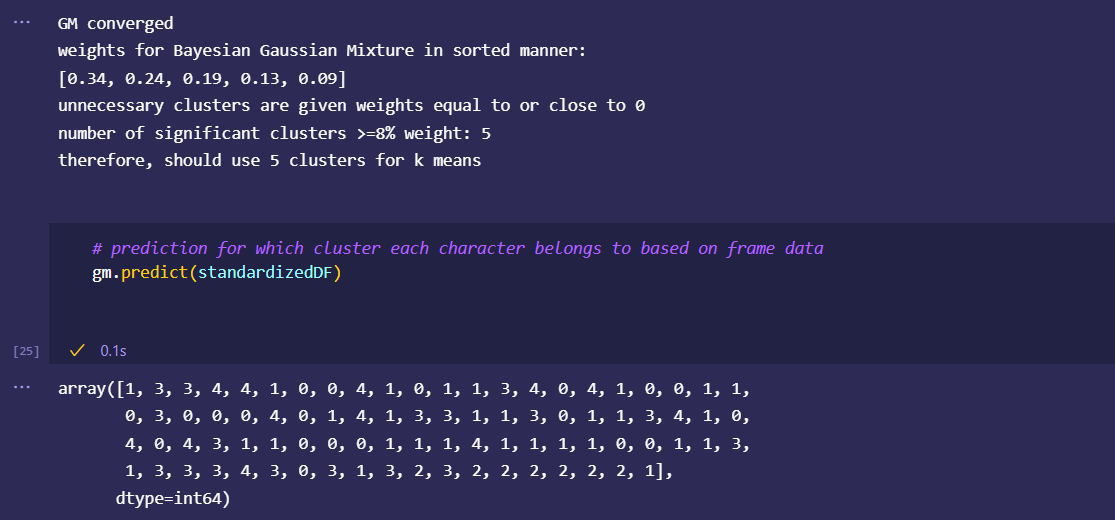
Selecting Bayesian Gaussian Mixture model for clustering and previewing predictions for character clusters
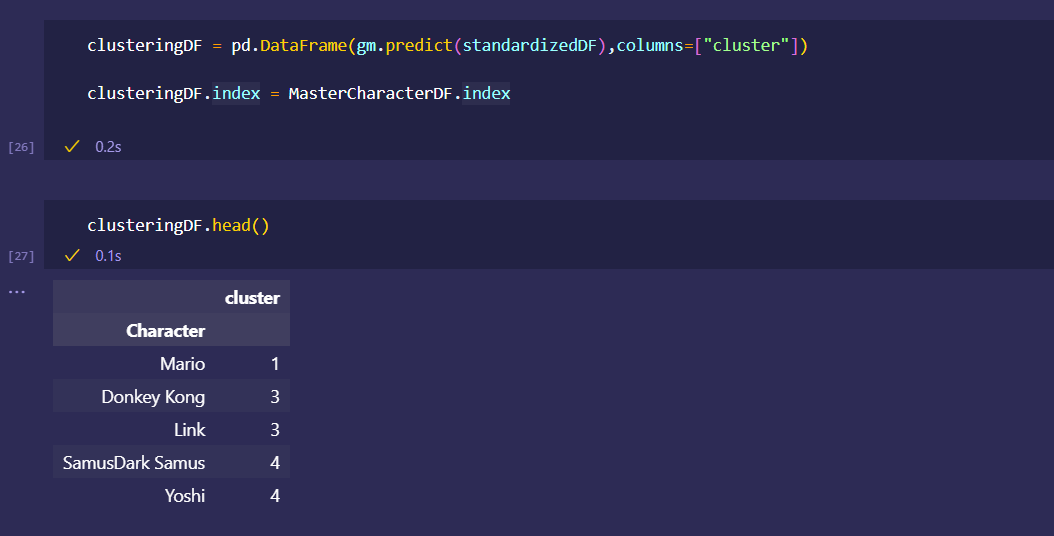
Dataframe readjustment to properly alignment character indexes and clusters
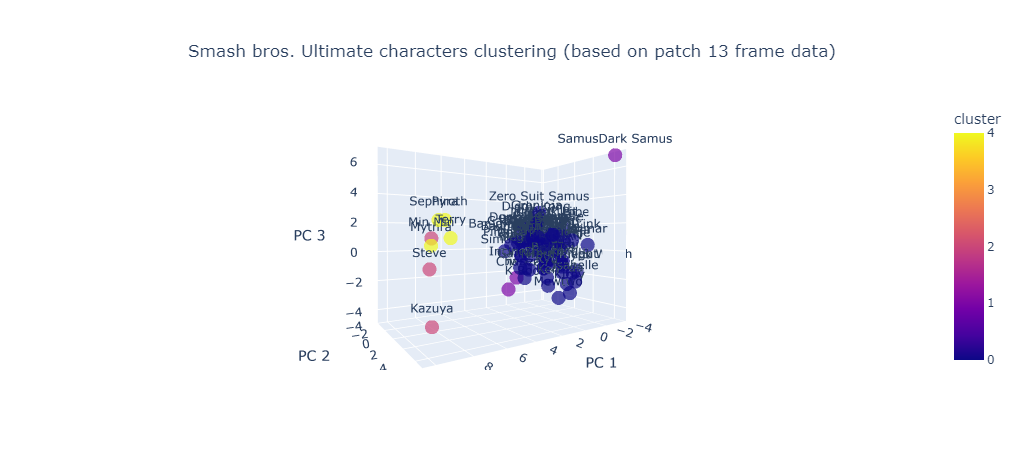
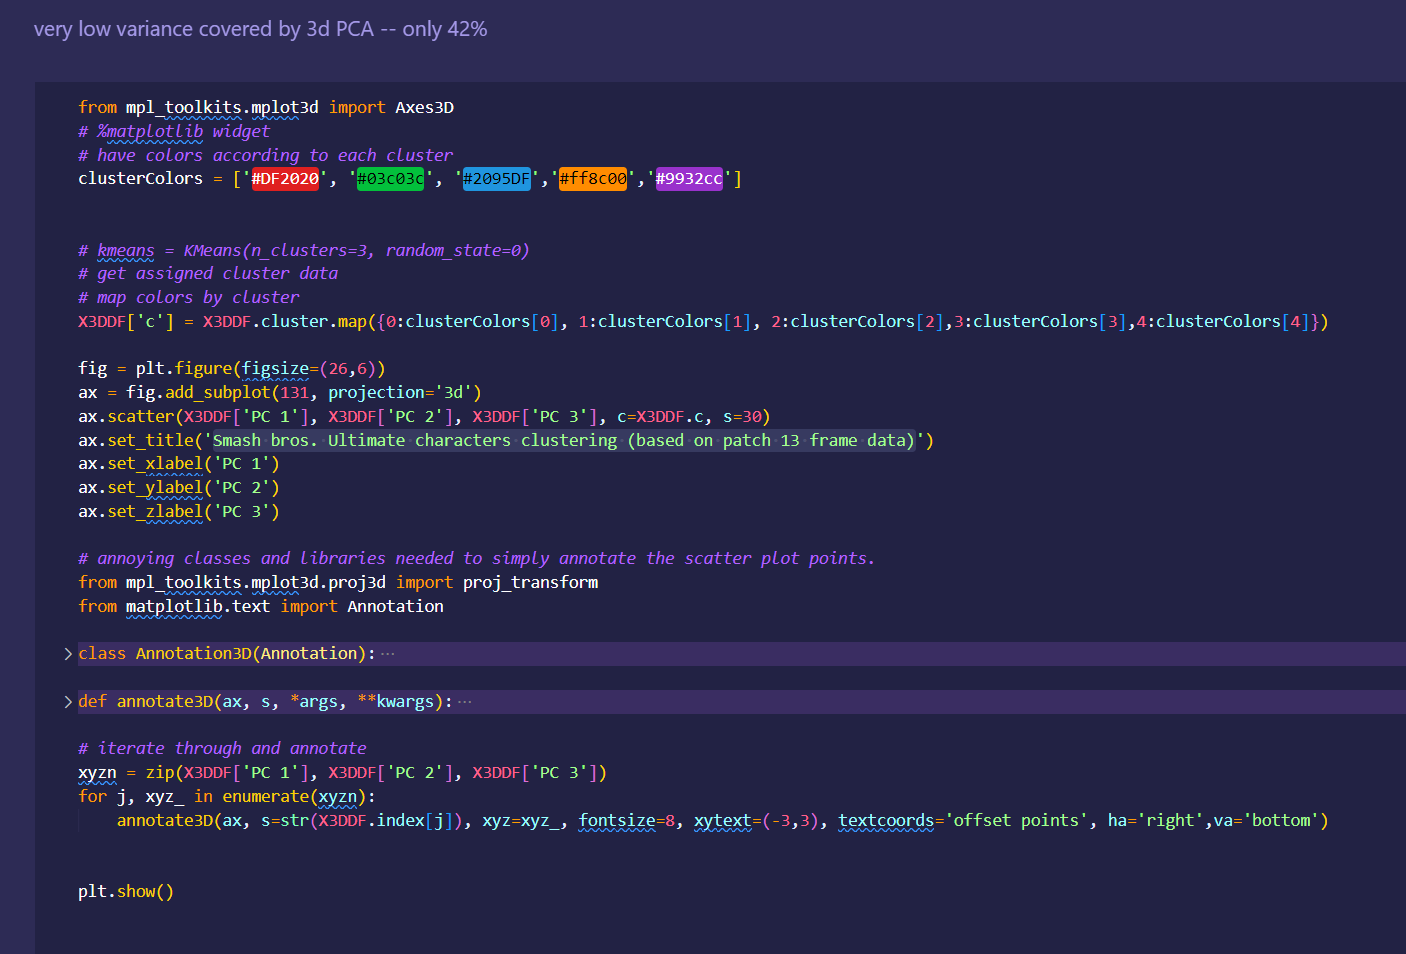
Code used to produce 3d matplotlib scatterplot using 3dPCA for cluster visualizations
Sample of training data...
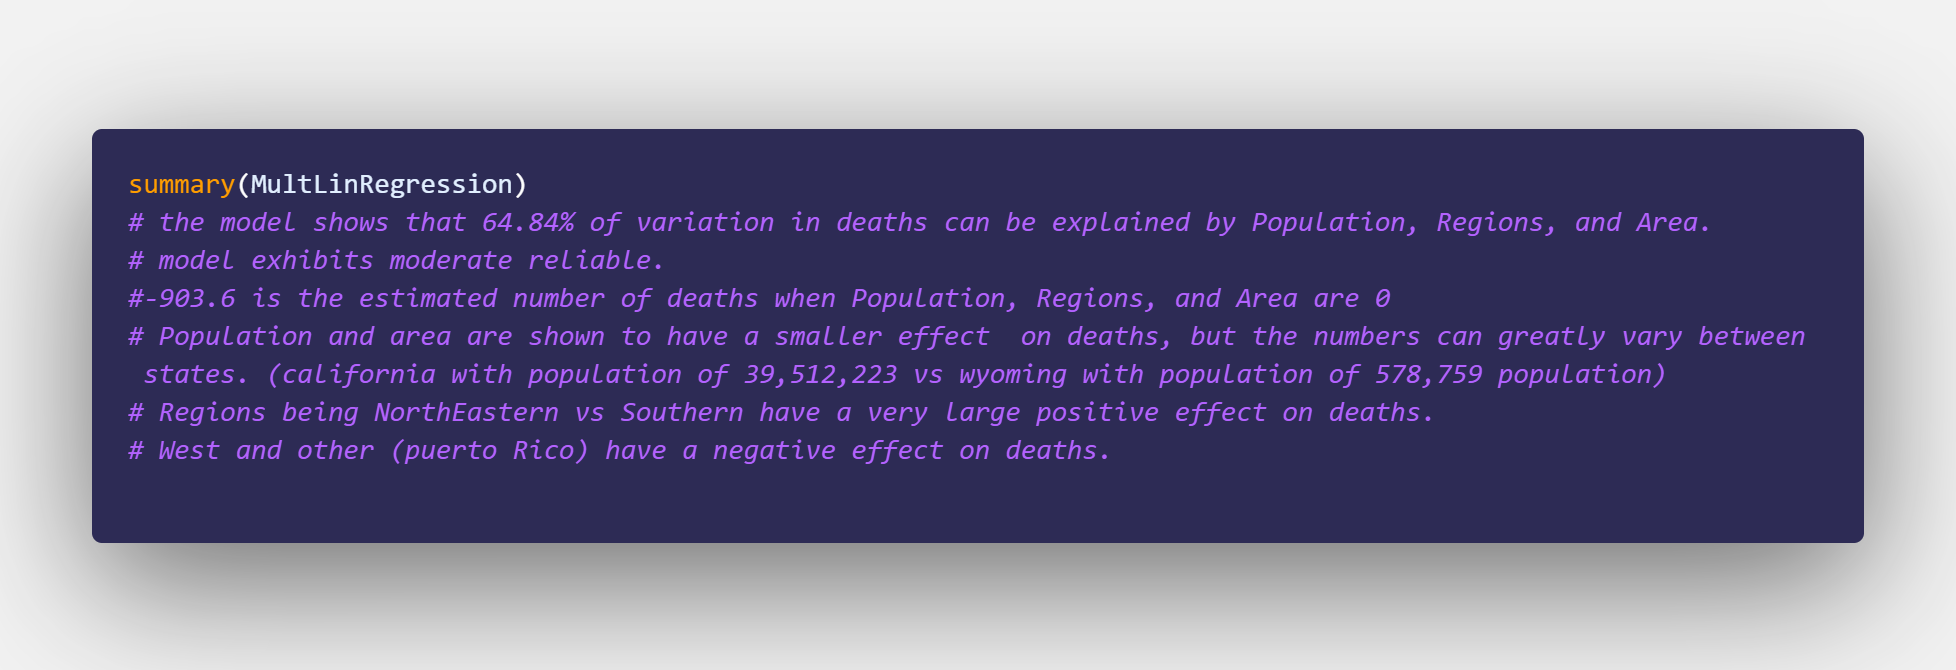
Summary and insights found within data
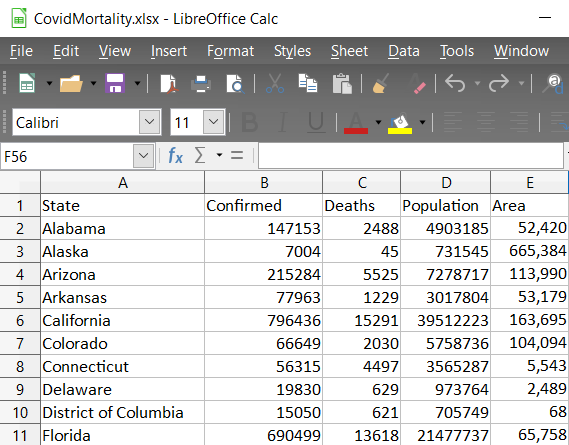
data viewed in Excel
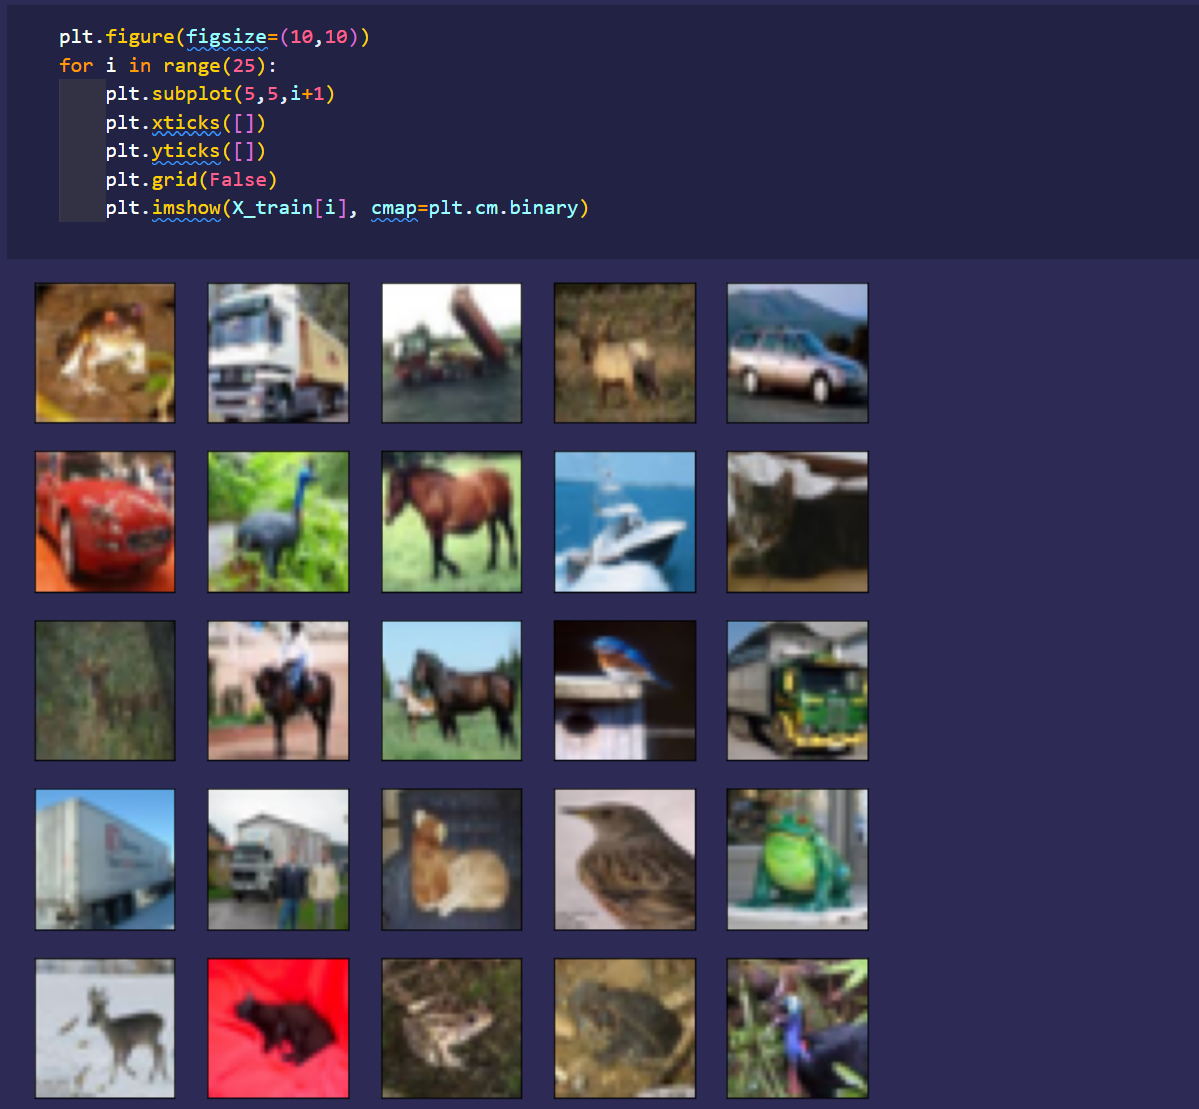
Loading in classification data samples and processing...
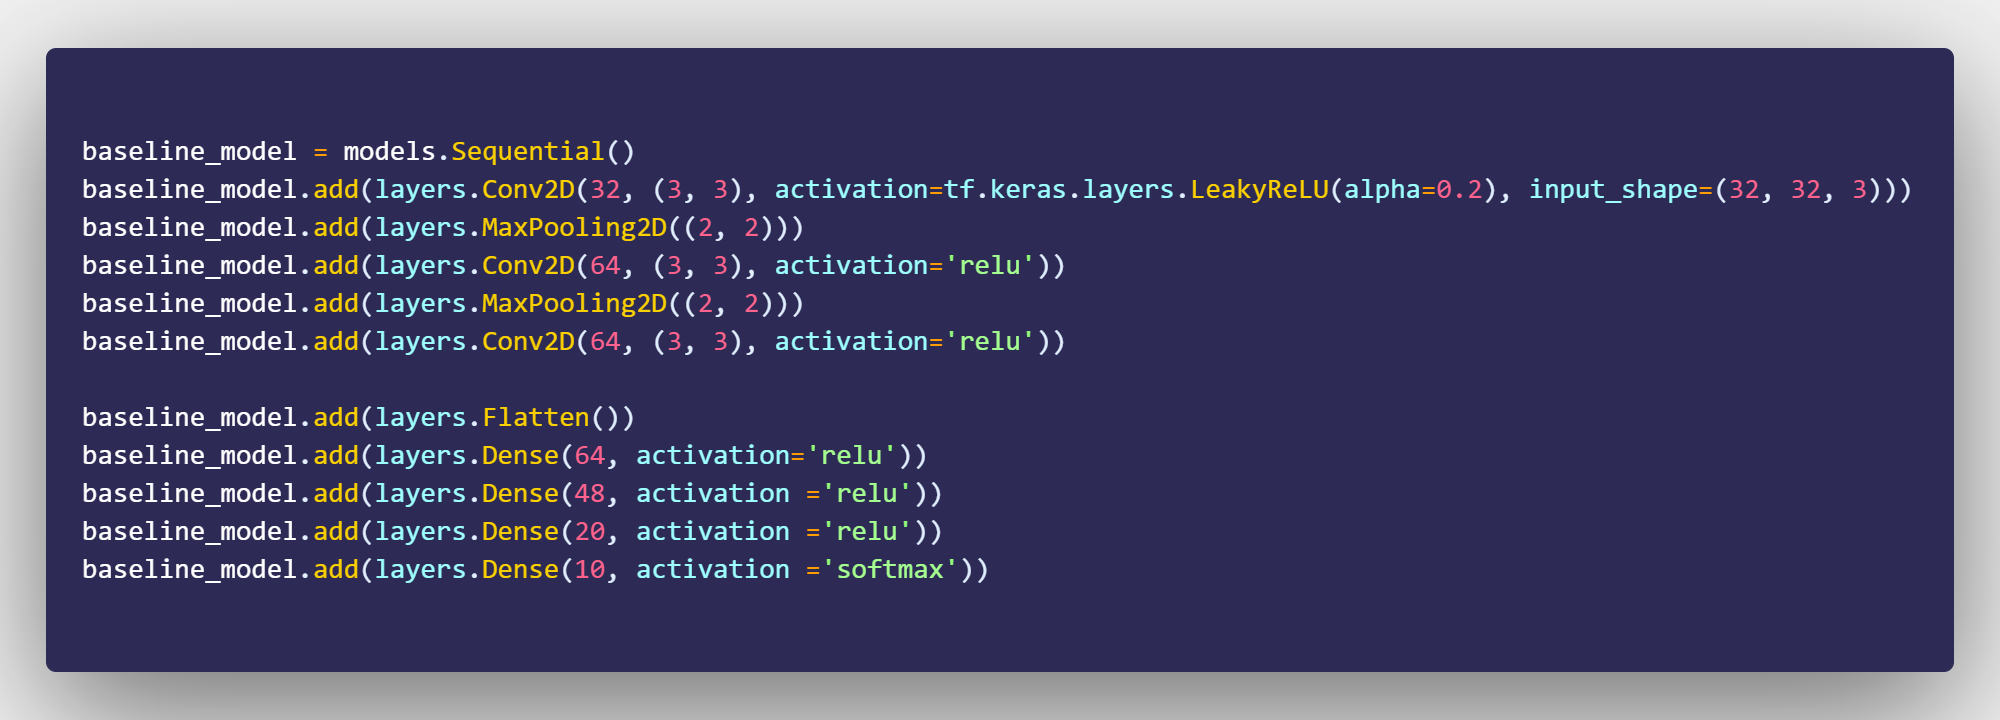
Initialization and arrangement of neural network with Tensorflow's API
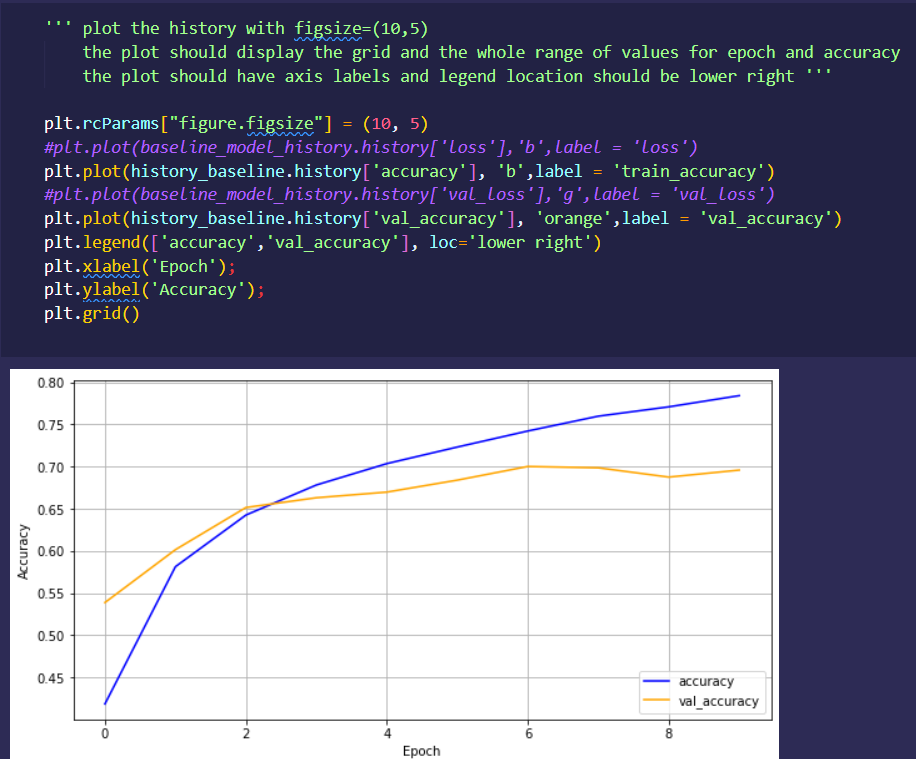
Plotting of baseline model training accuracy over 10 epochs
(70% accuracy reached on test set)
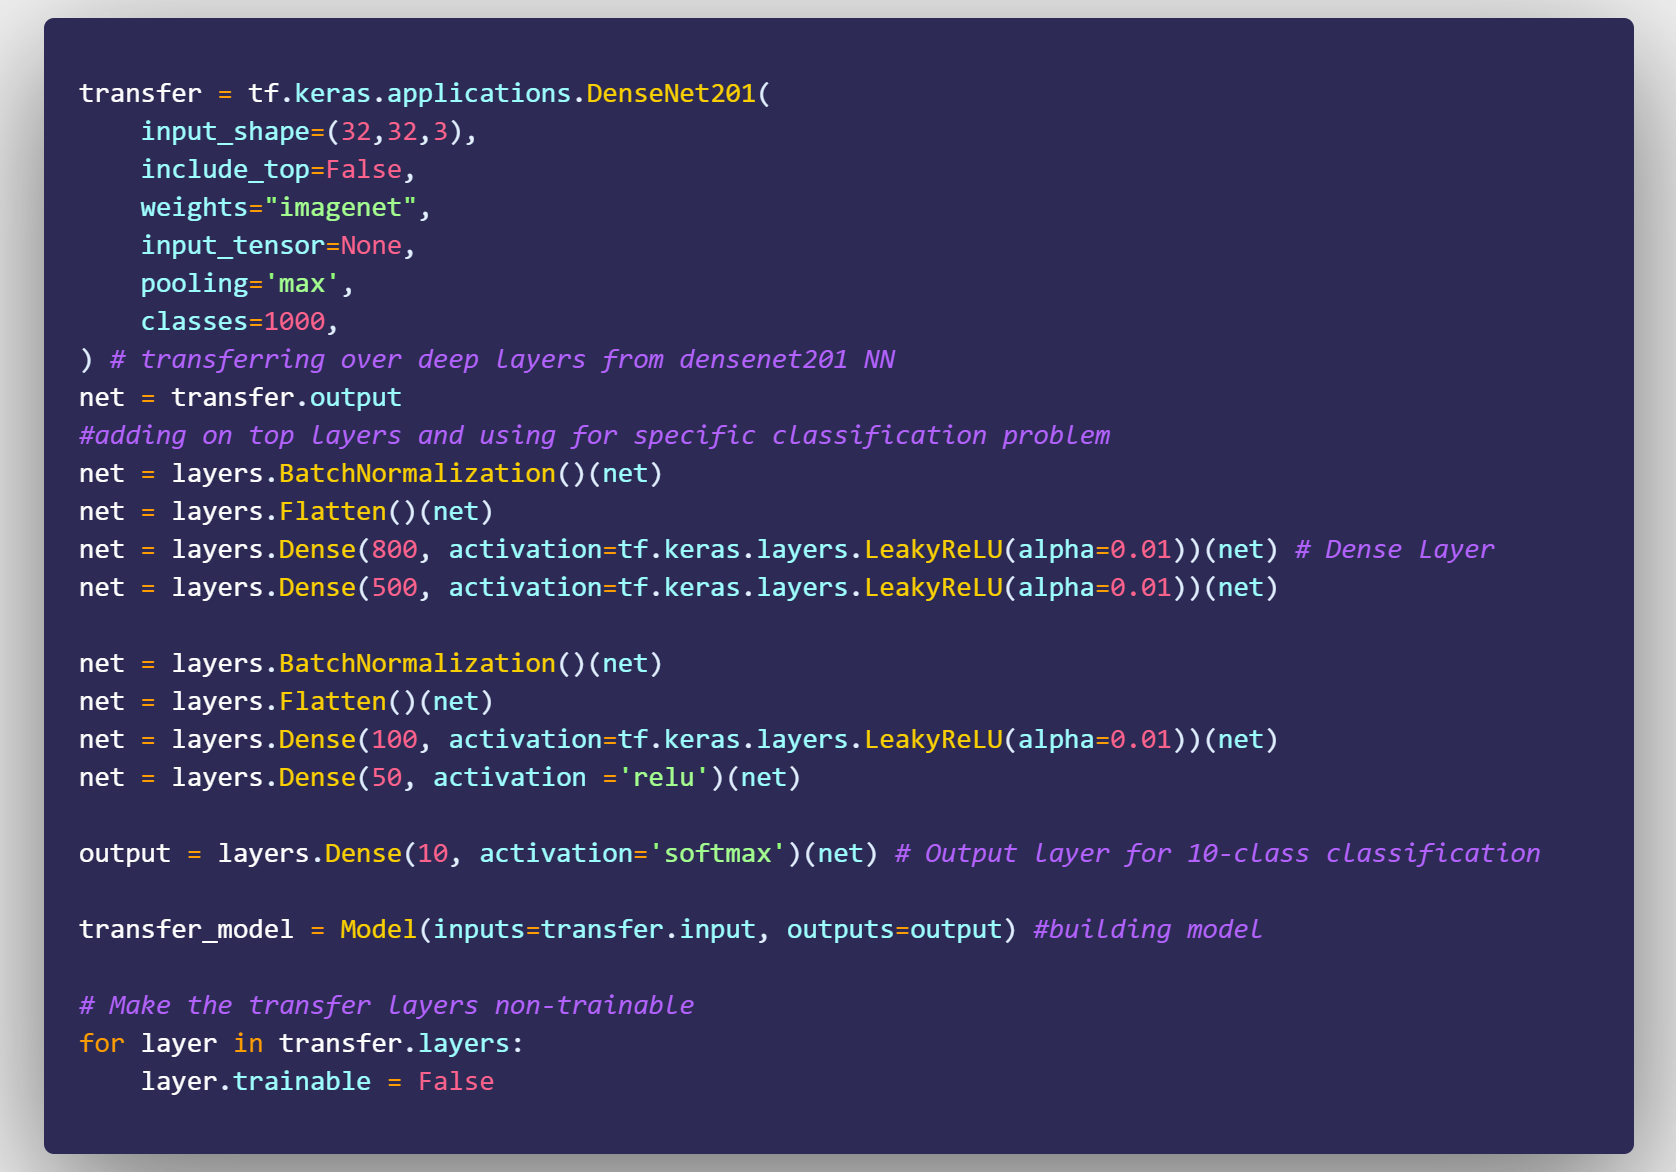
2nd model attempt made, this time using transfer learning
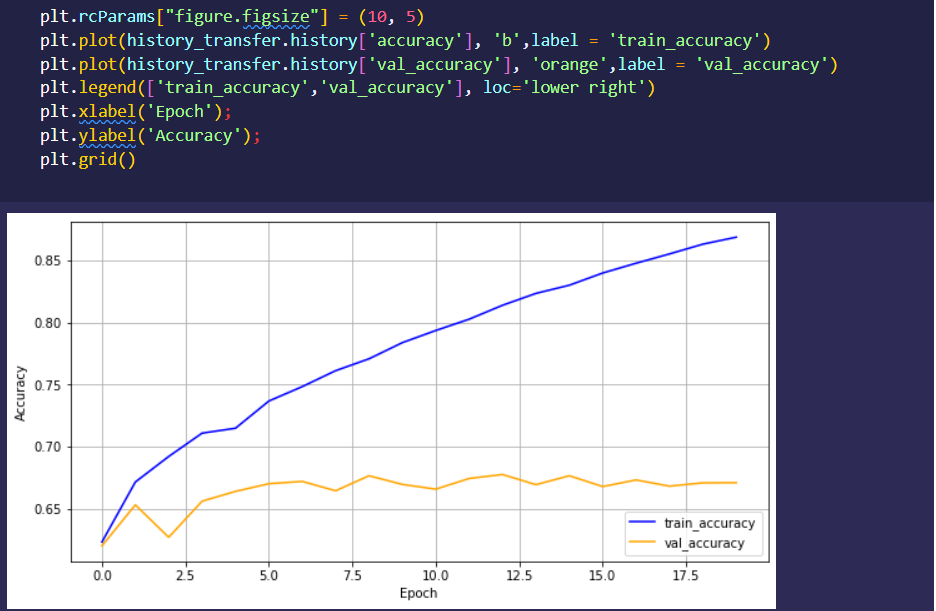
transfer learning training progress over 20 epochs
(67% accuracy reached on test set)
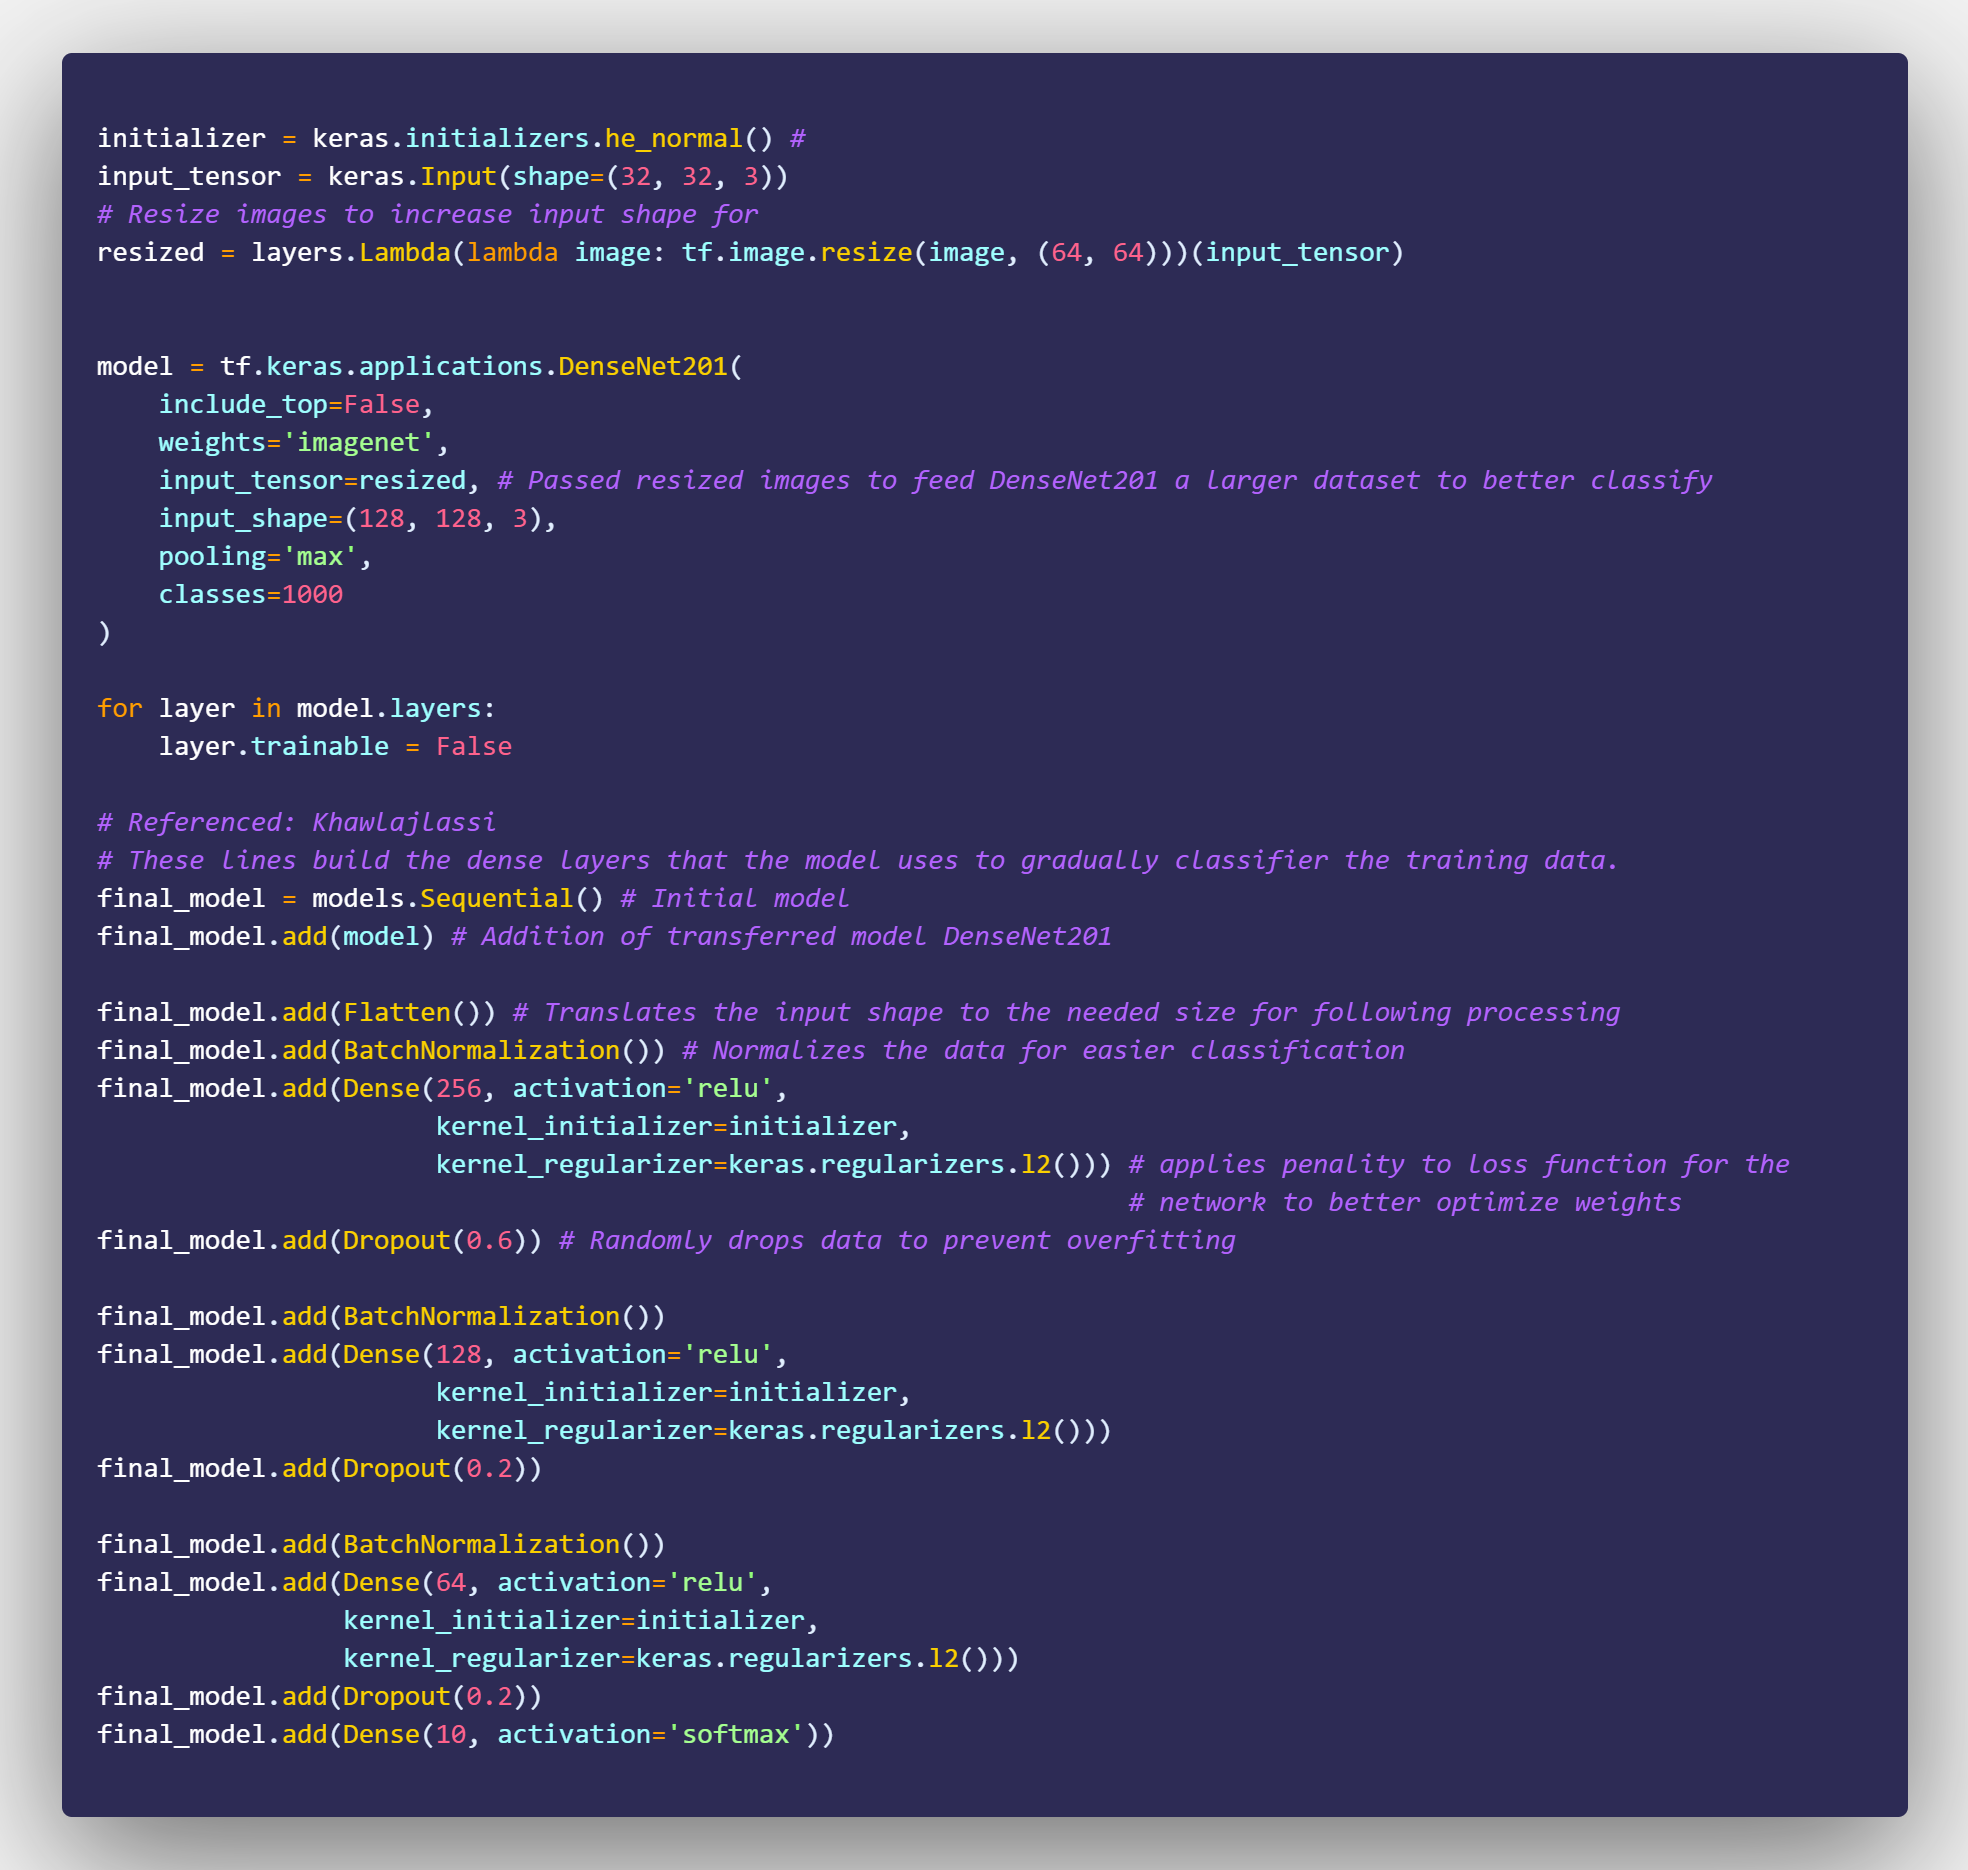
Final model implementing transfer learning, convolutional layers, batch normalization, and dropout
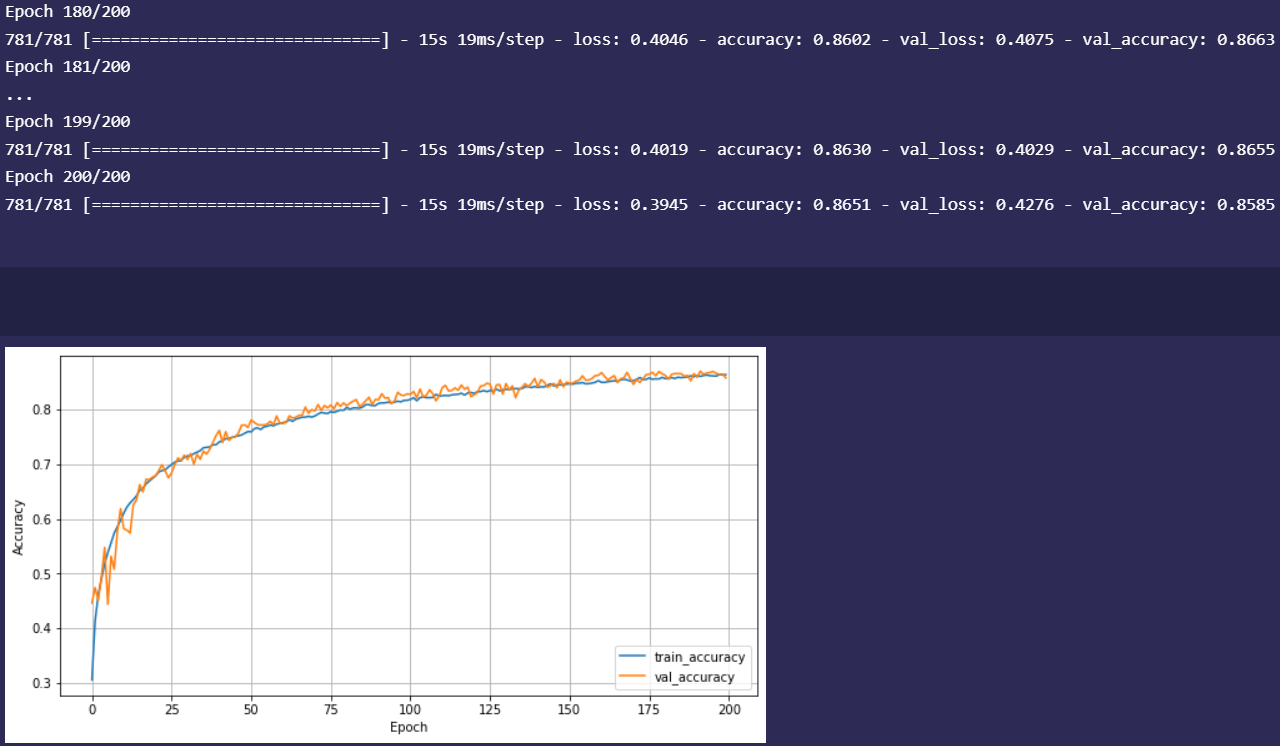
Final results plotted over 200 epochs yielding in 86% classification accuracy of test set
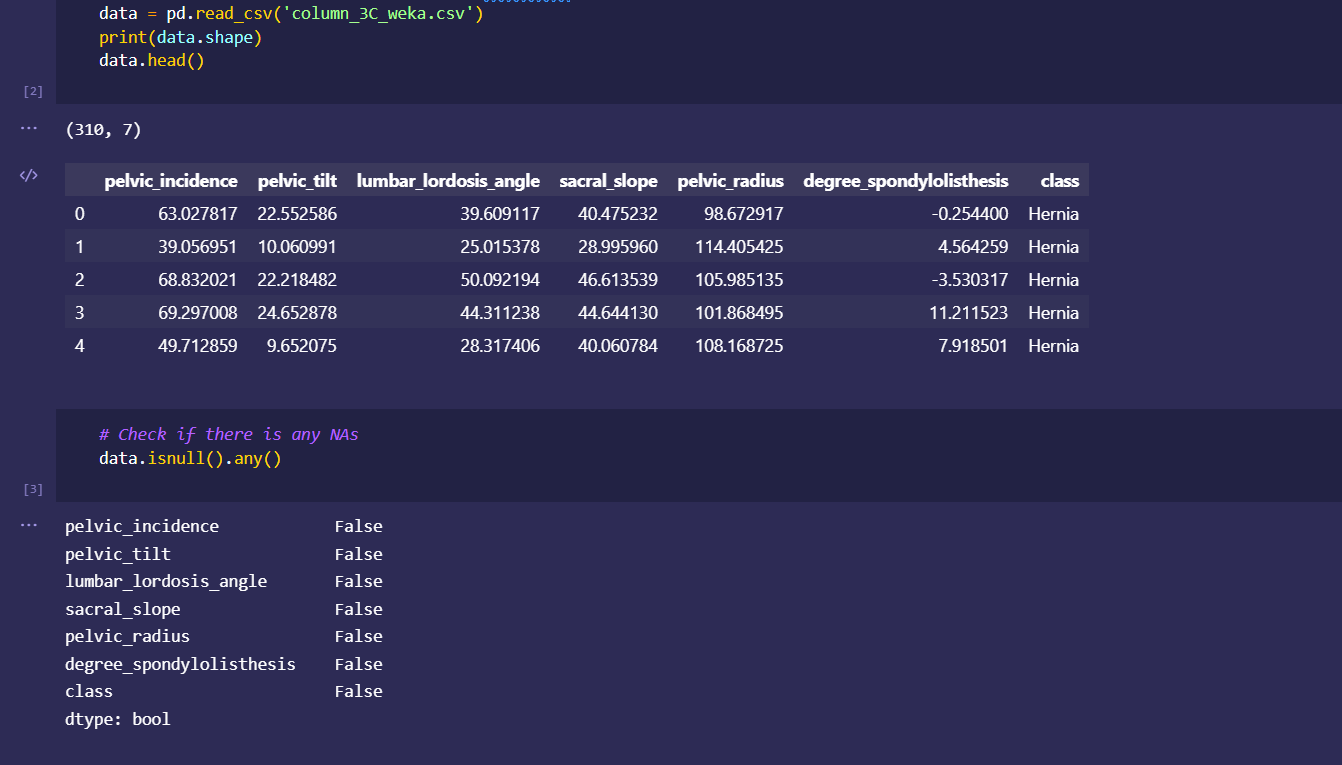
Preprocessing of data and splitting into test/training groups
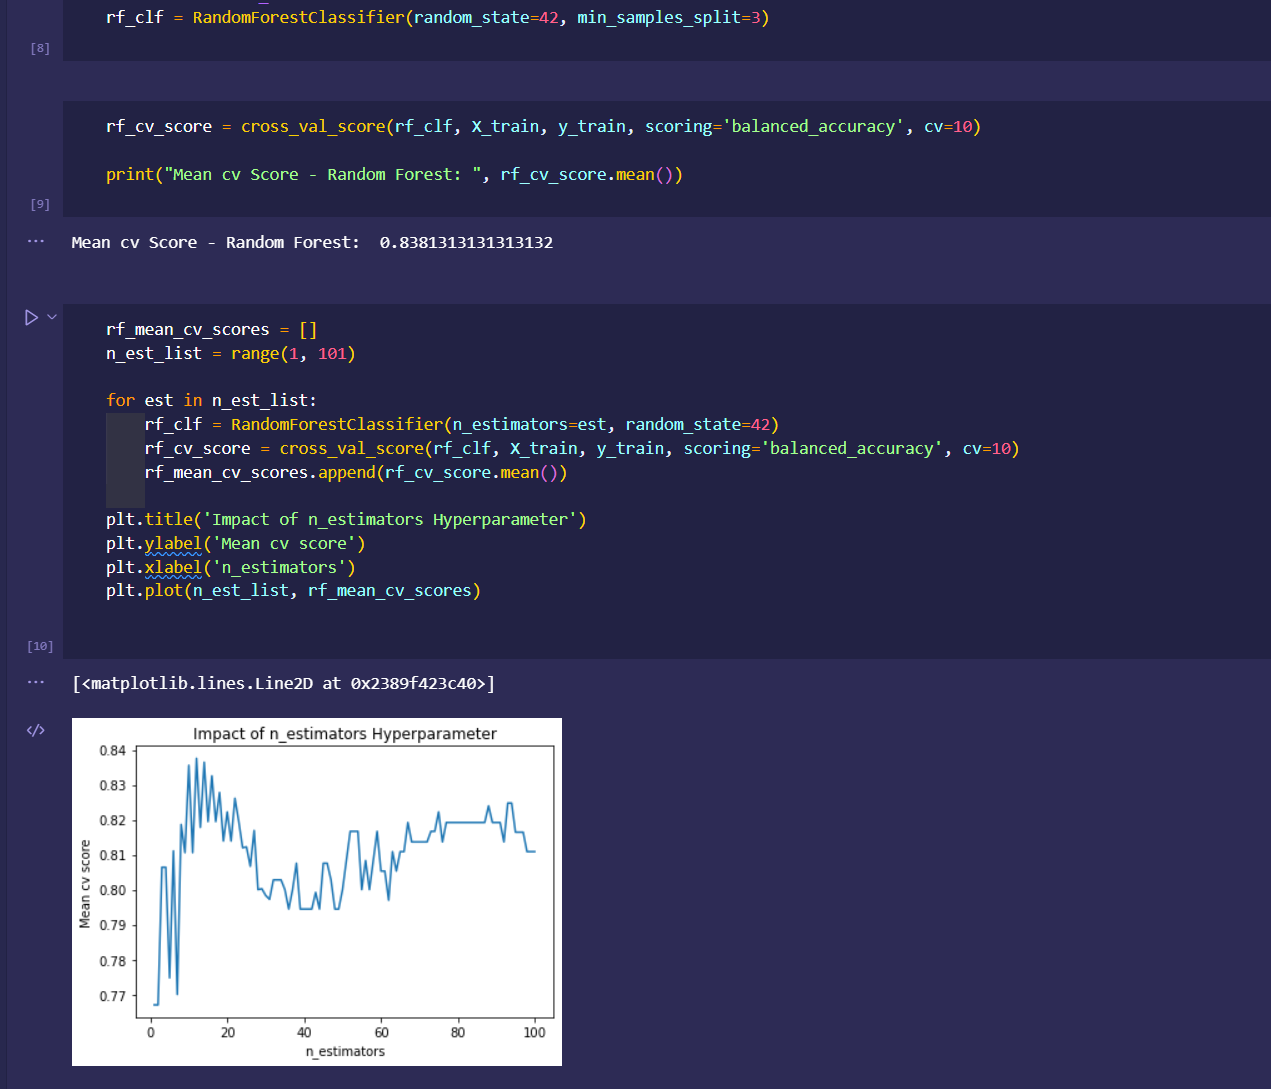
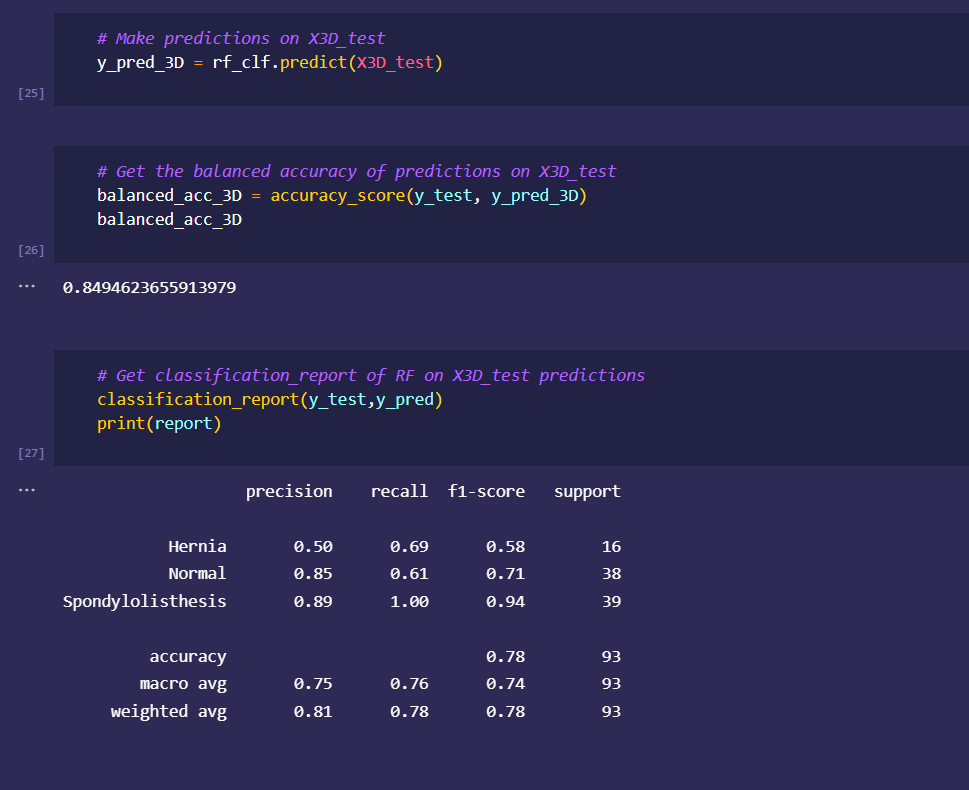
Evaluating balanced score of random forest classifier and graphing hyperparameter optimization
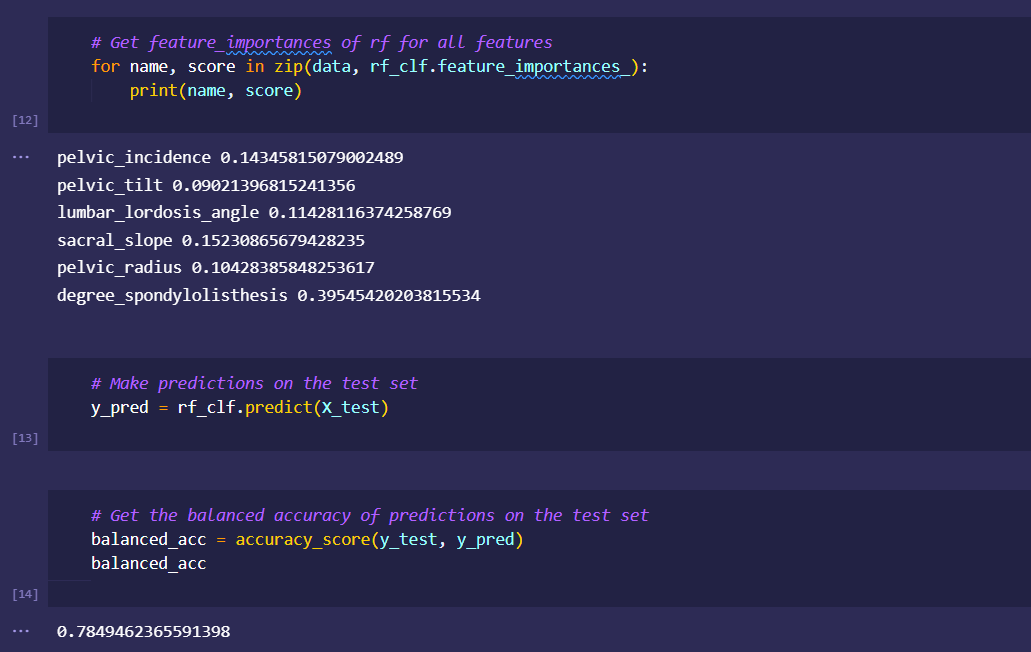
Finding accuracy and feature importance of random forest
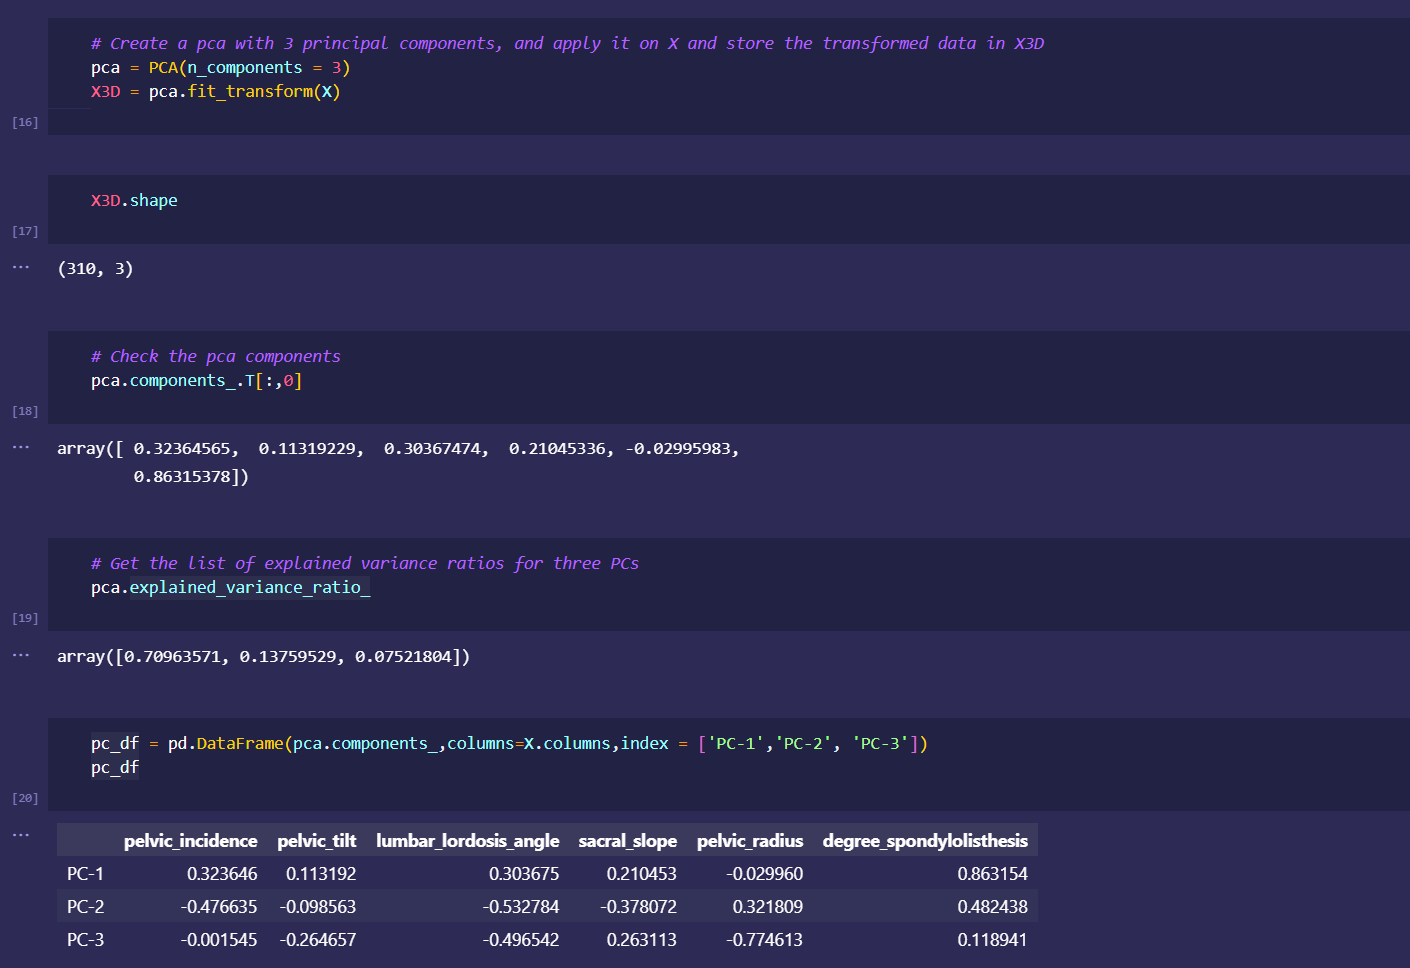
Running principal component analysis to see top features of data set
Using top 3 principal components in data to cover variance
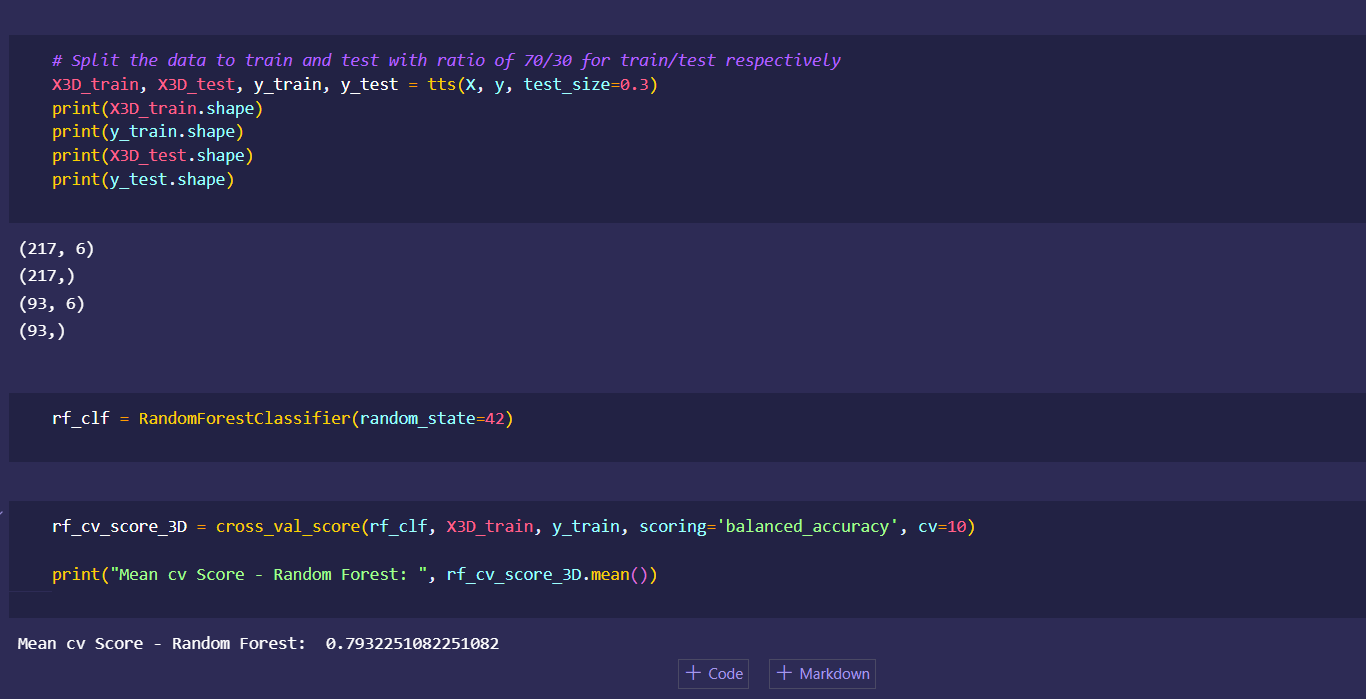
Balanced accuracy of random forest relying on principal components
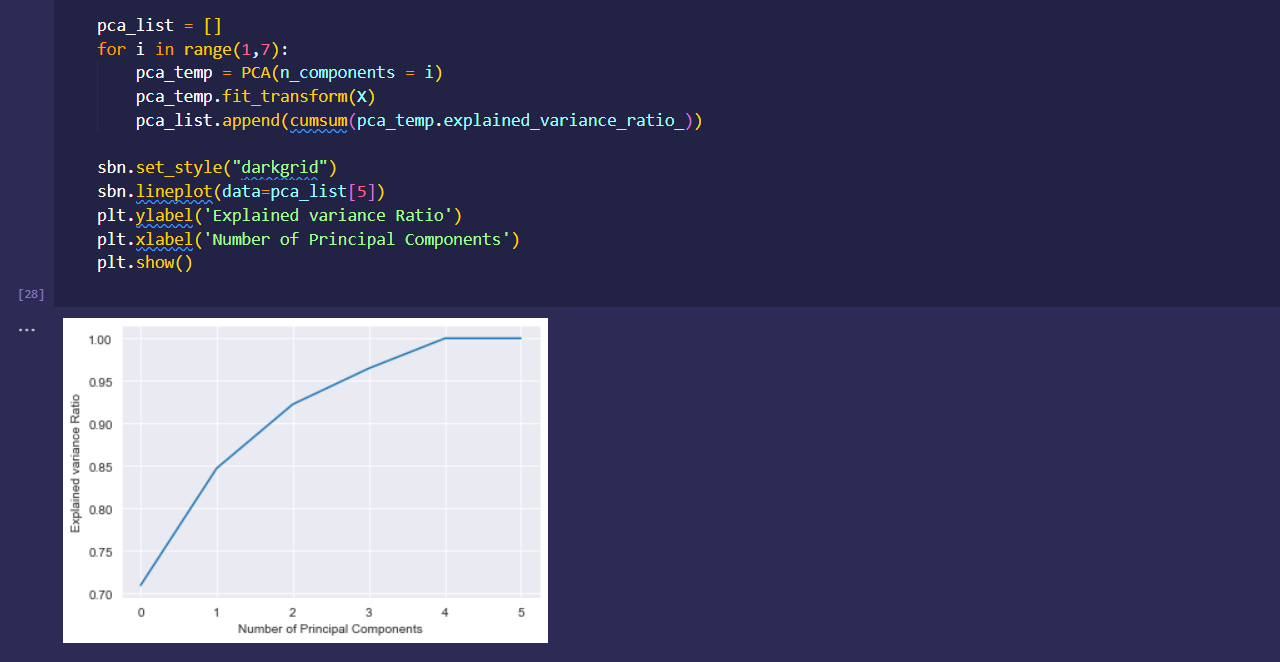
Graphing the optimal amount of principal components to use to cover 95% variance of original data
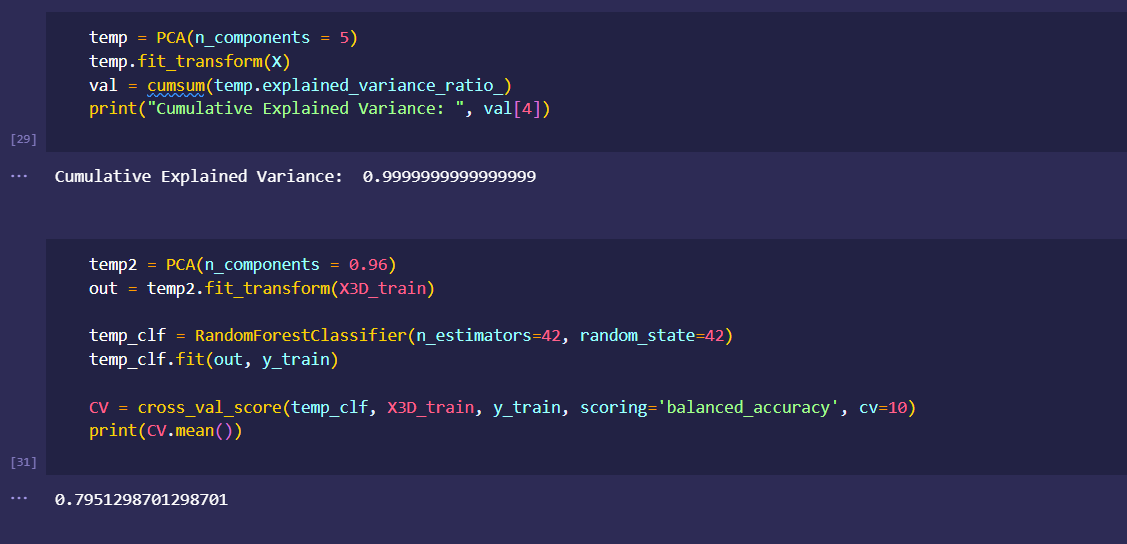
Accuracy using optimal random forest along with optimal number of principal components to predict data with less.
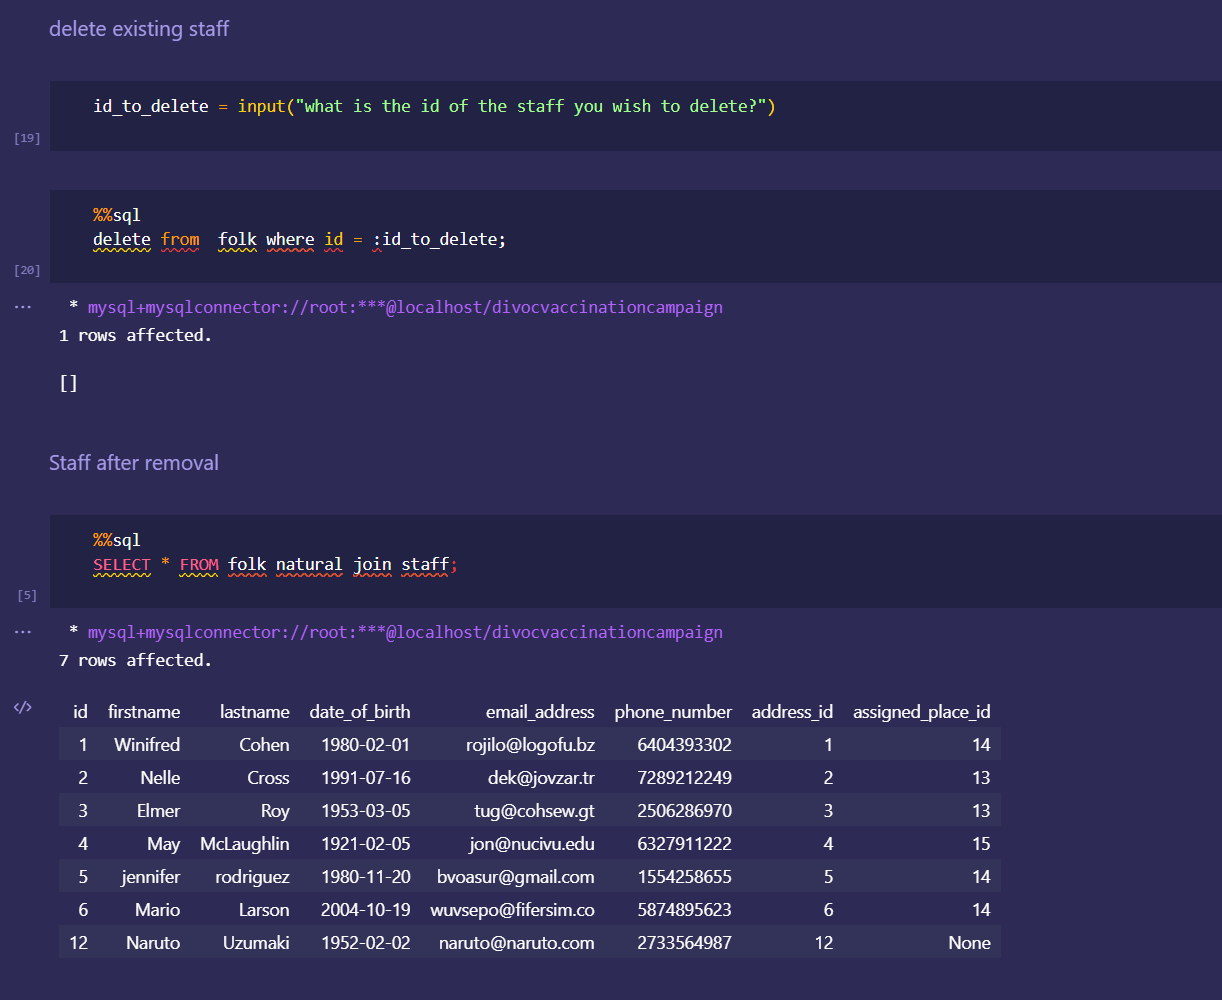
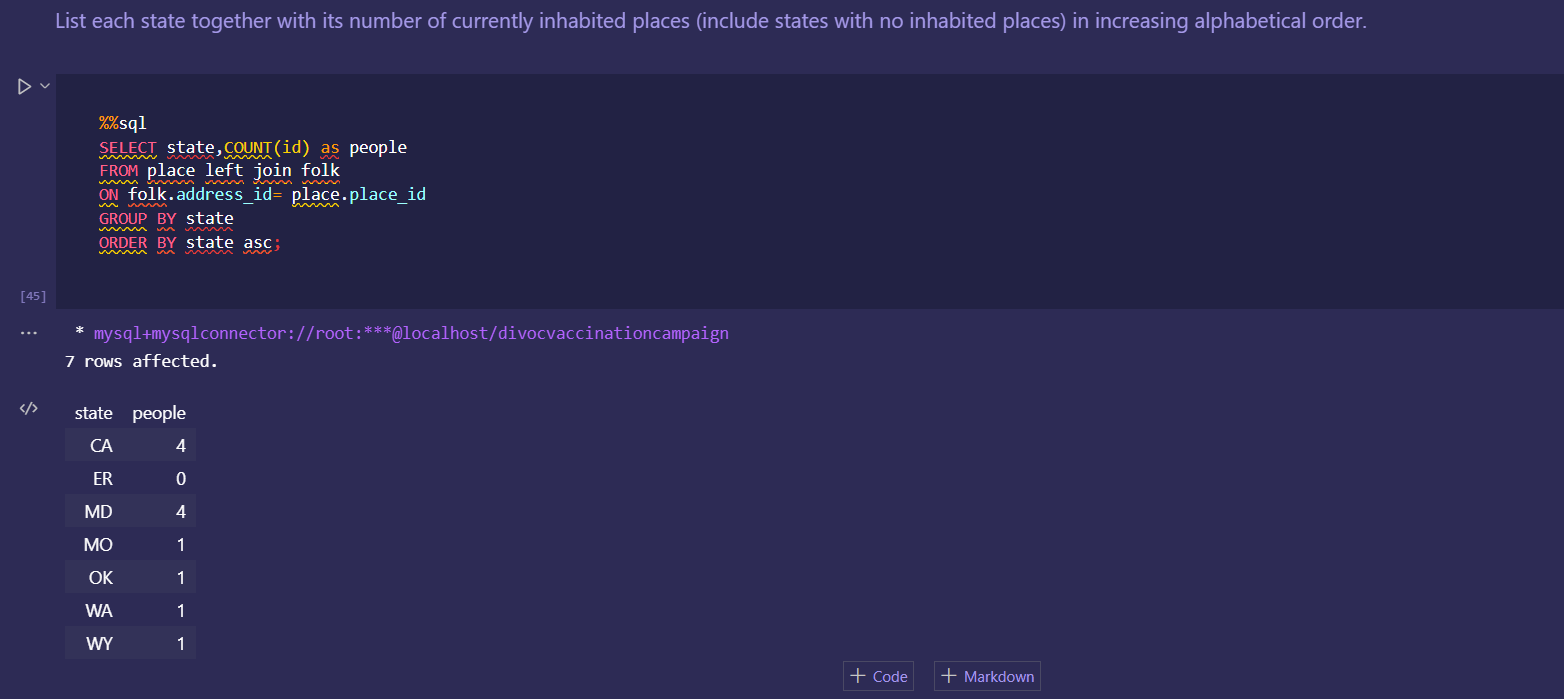
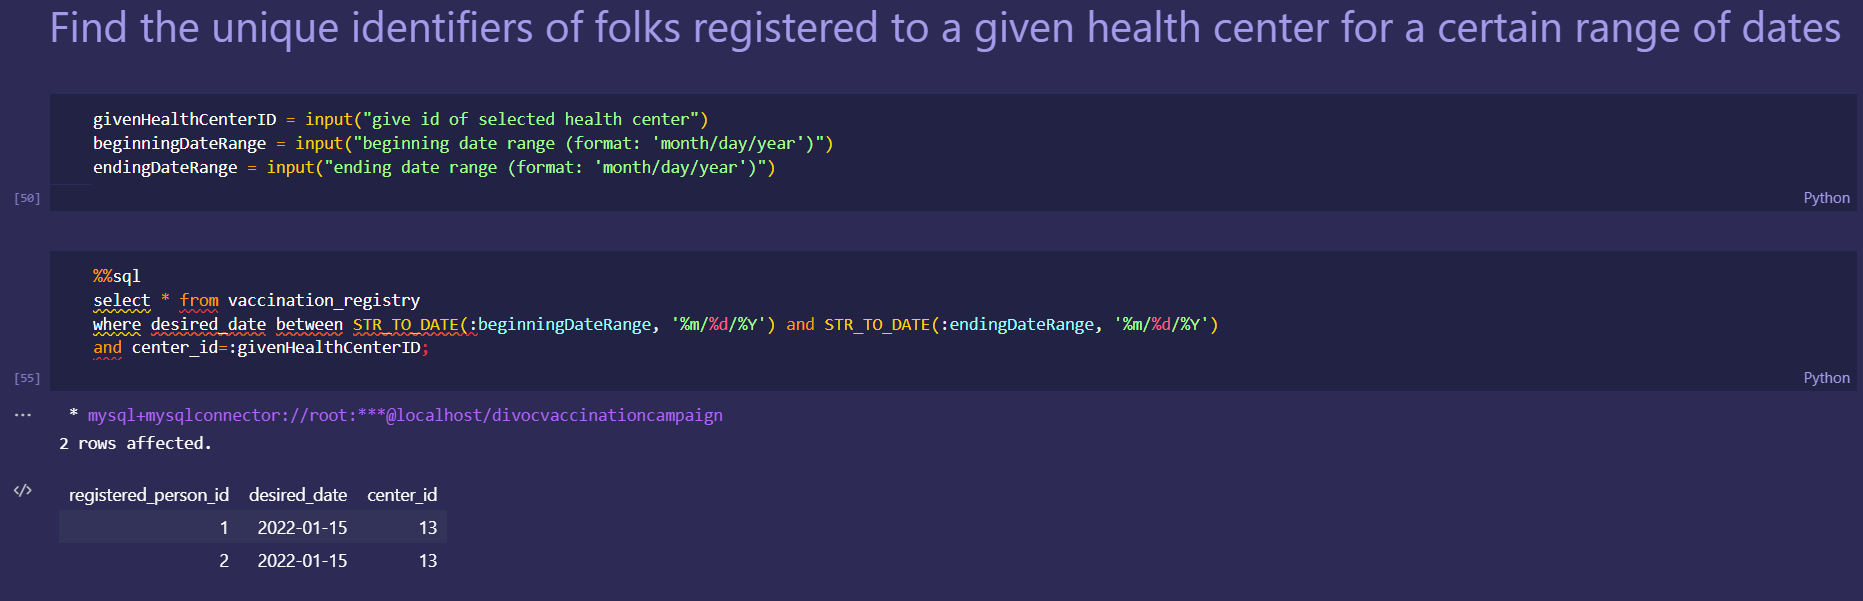
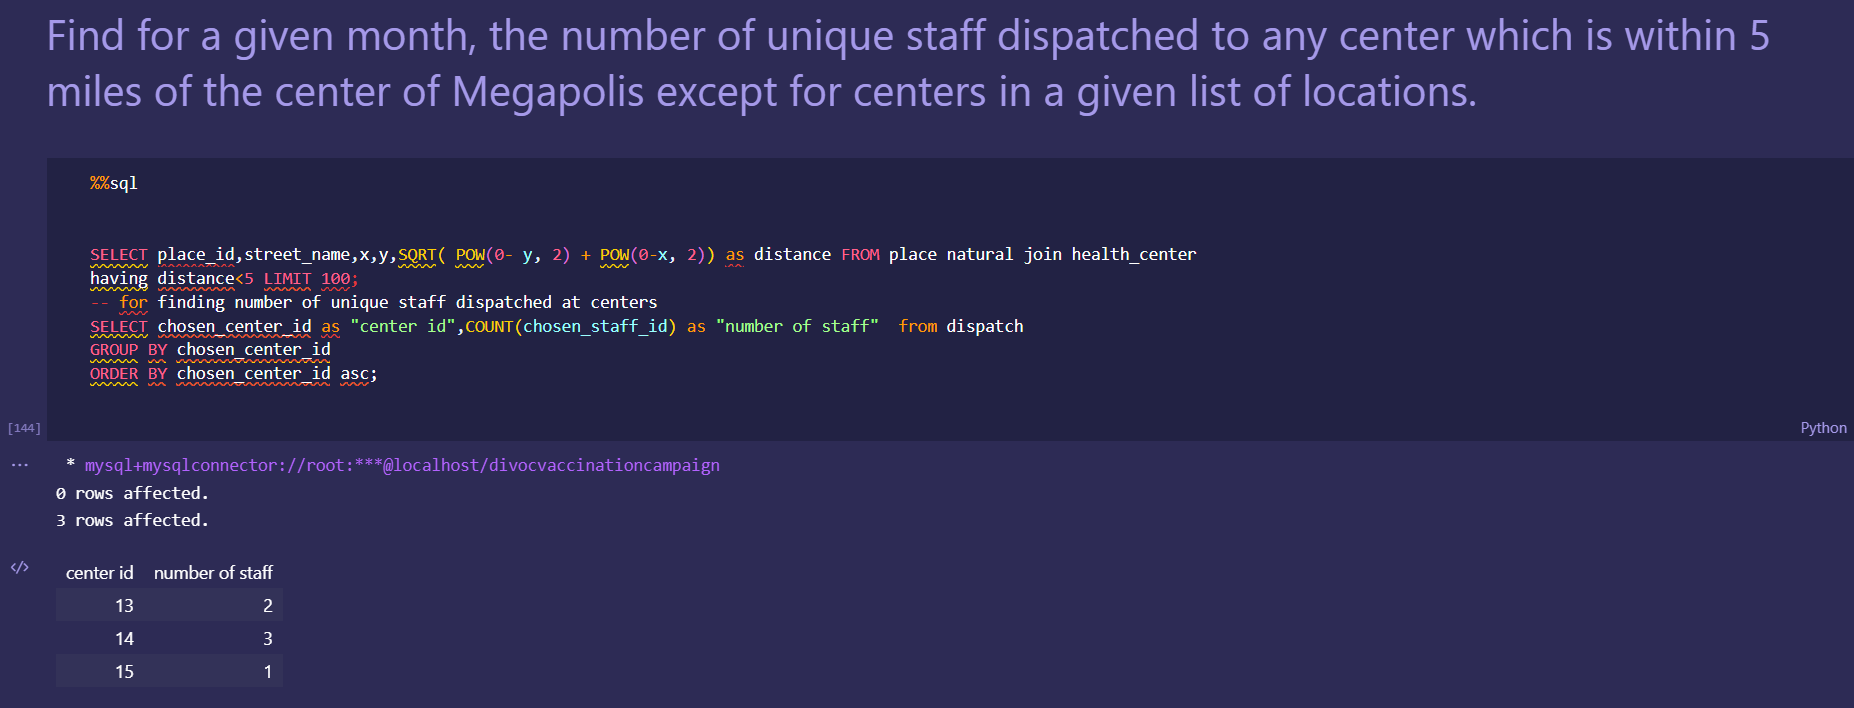
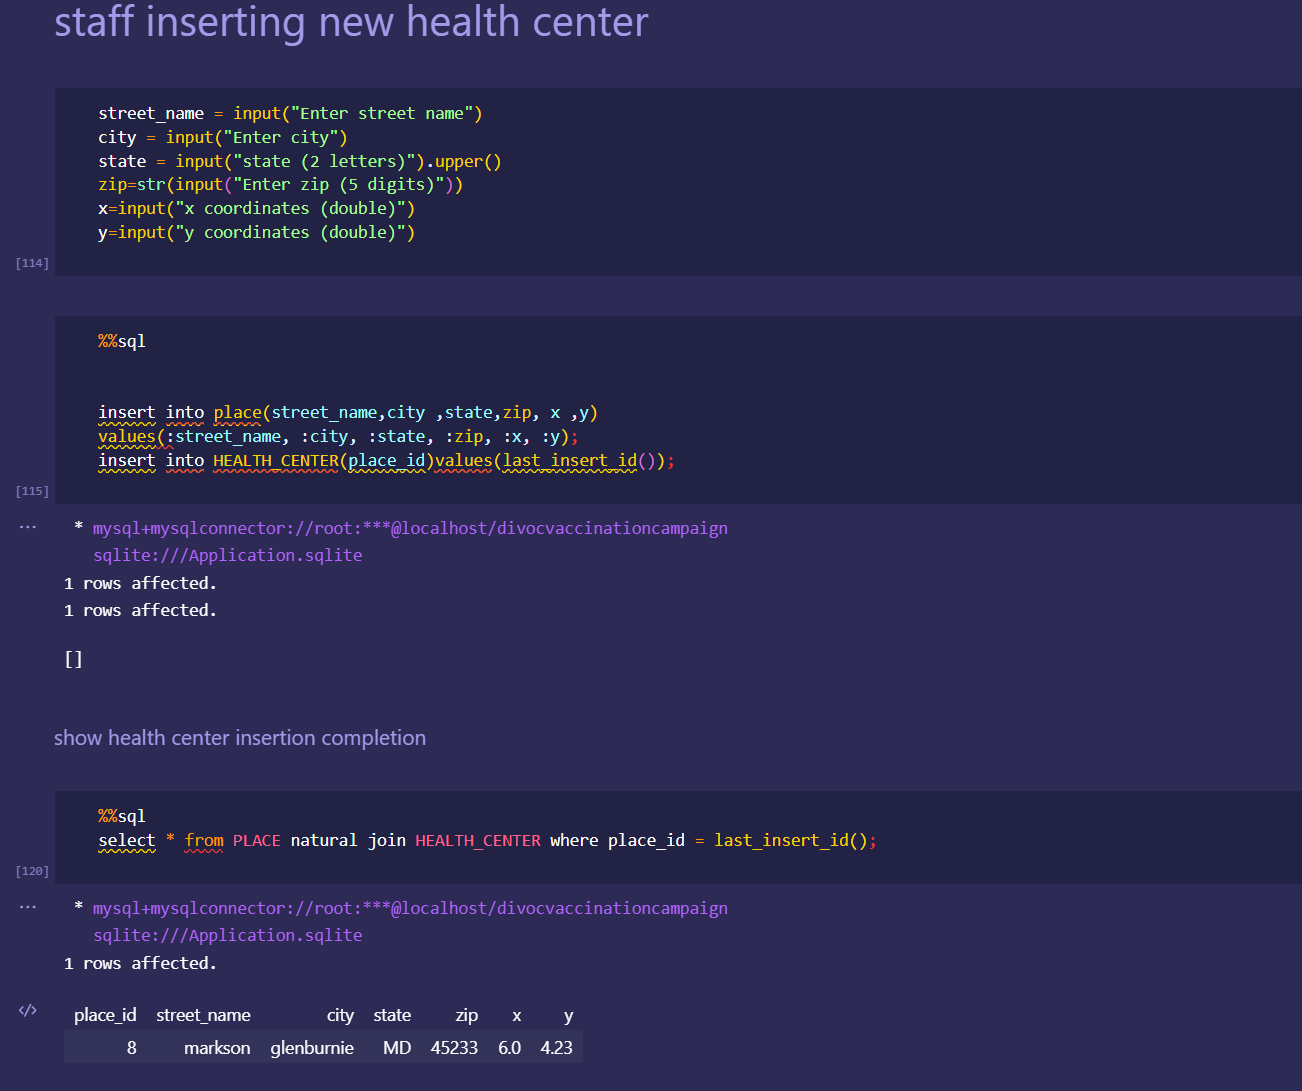
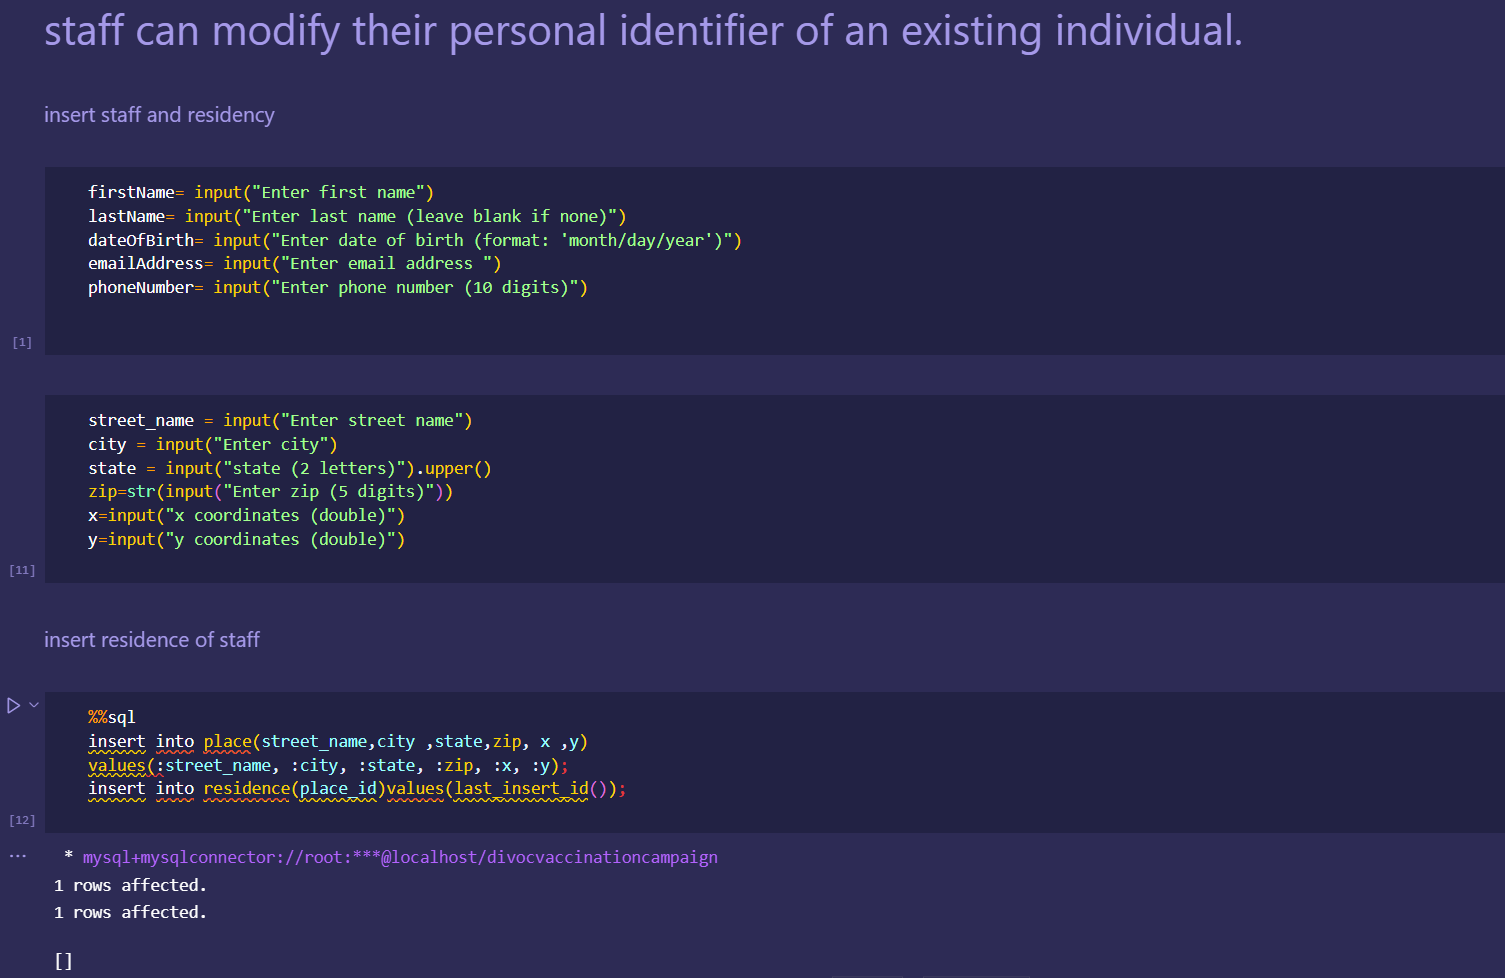
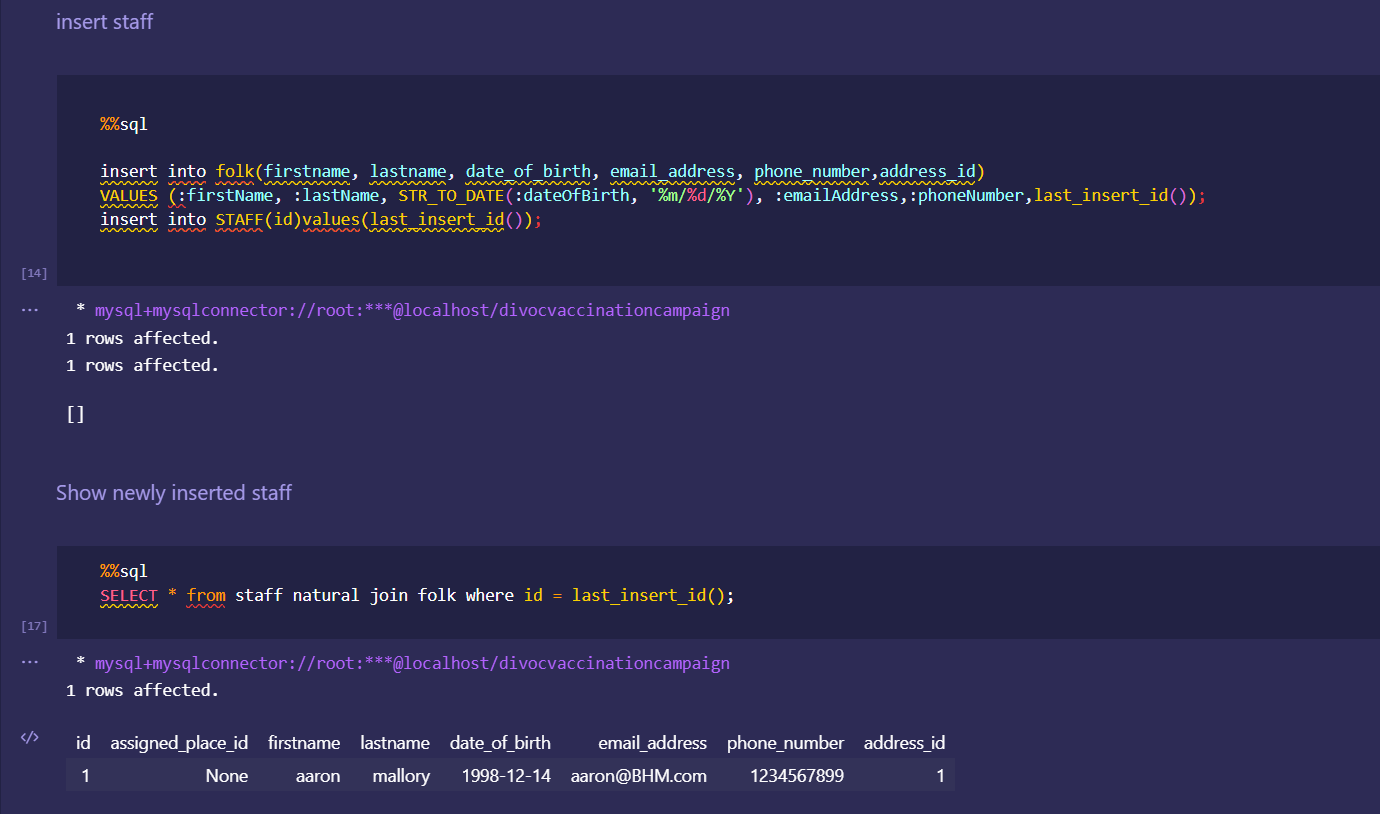
Various queries displayed within Database
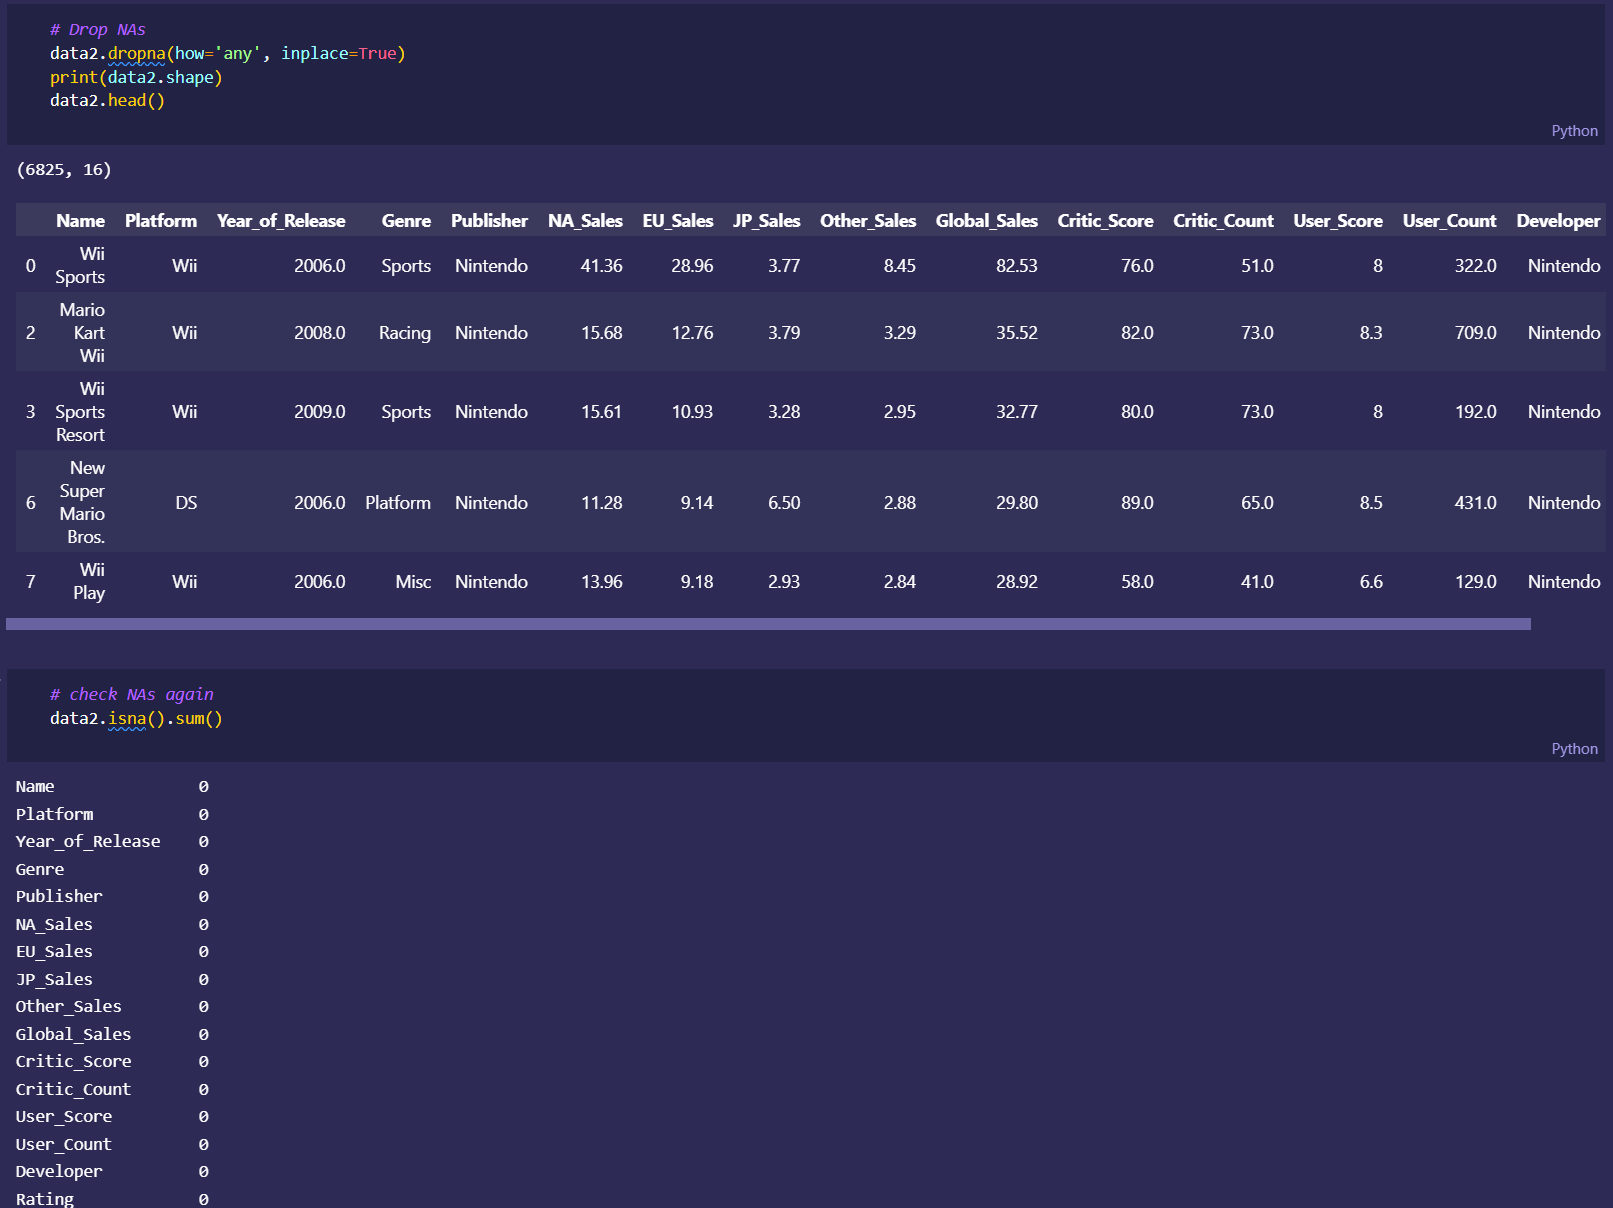
Preprocessing videogame data and cleaning NA values.
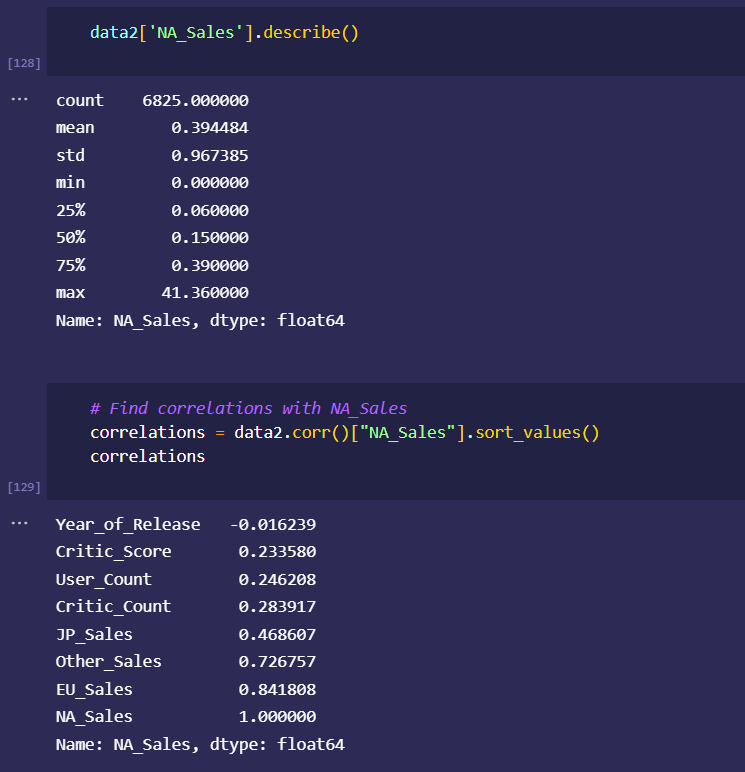
More basic analytics done on data before building model
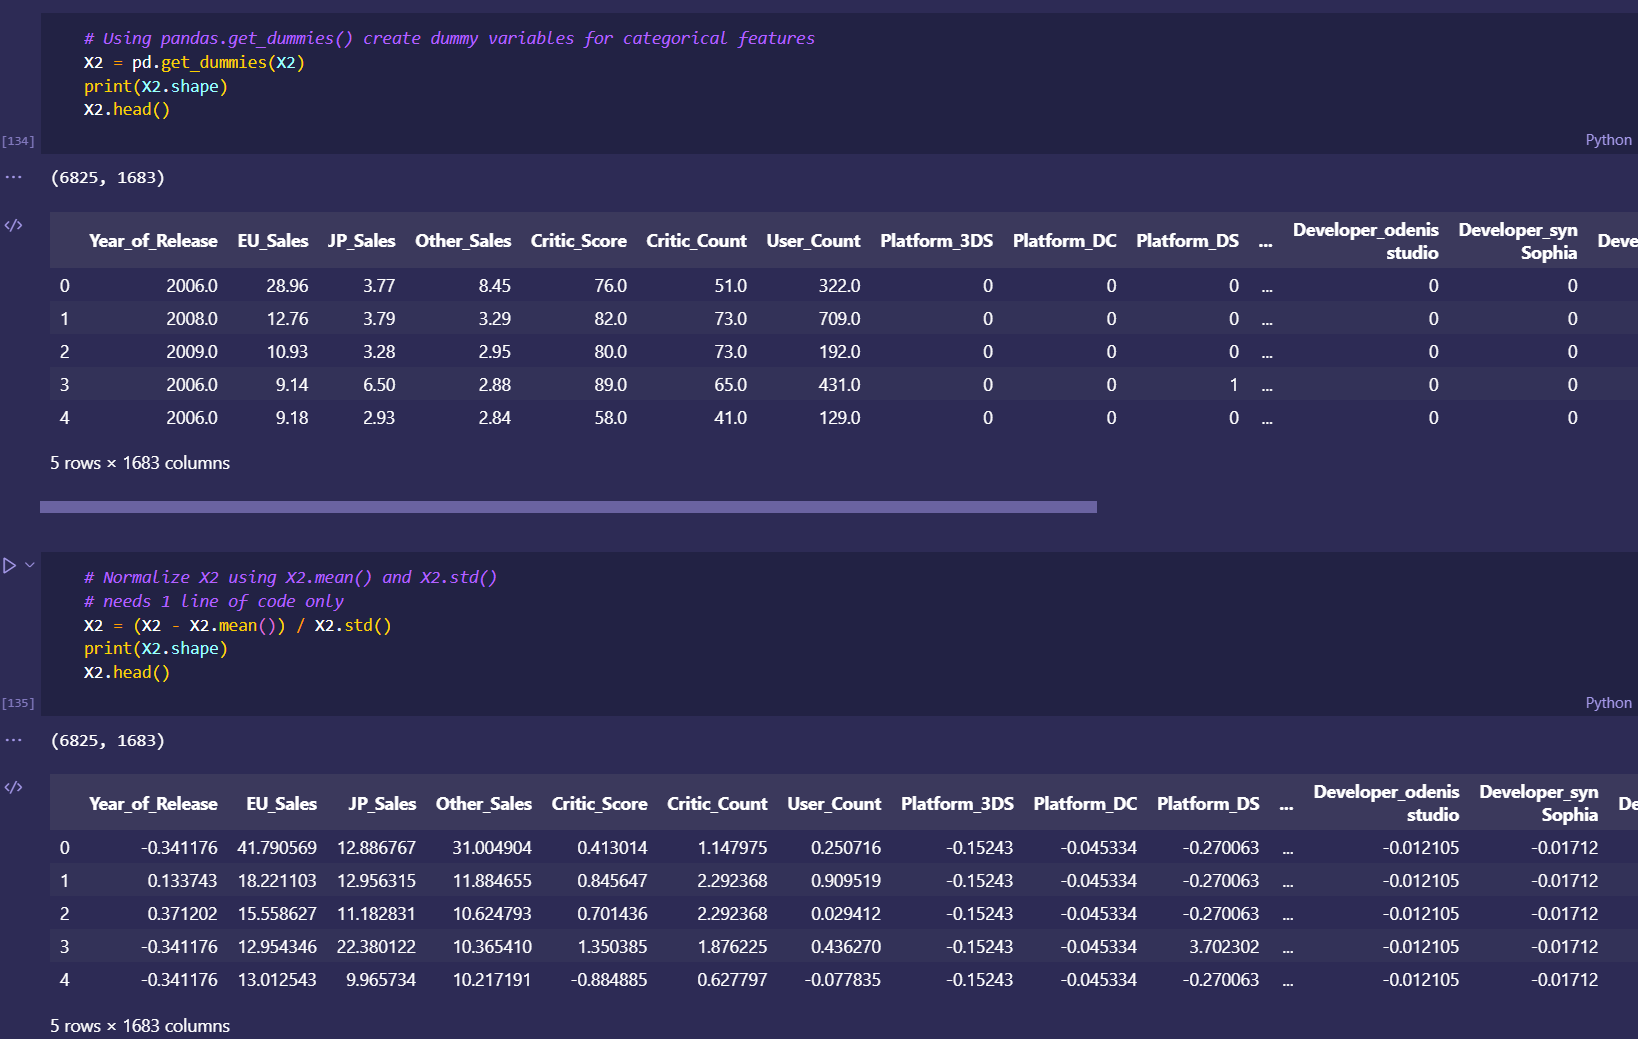
More preprocessing, this time adding dummies and normalizing features
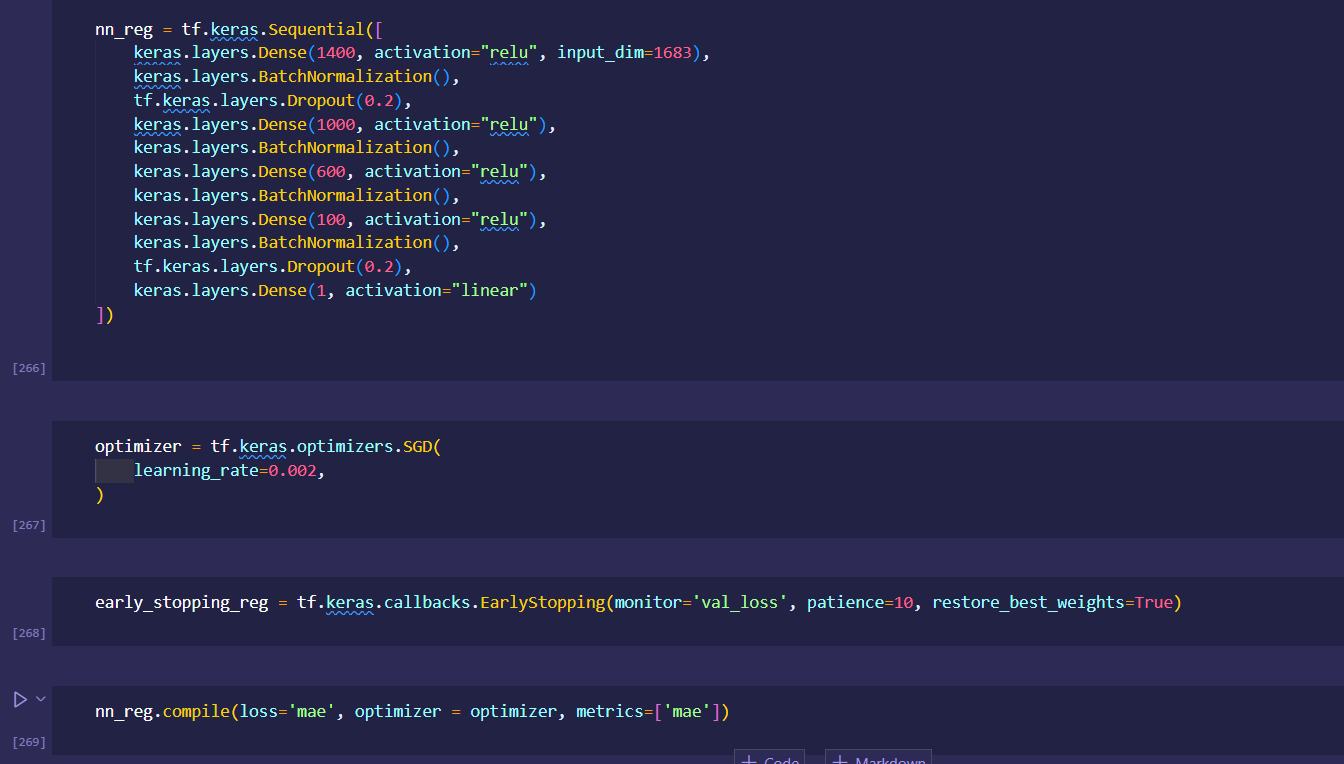
Complex neural network model with Keras on the cleaned data for regression
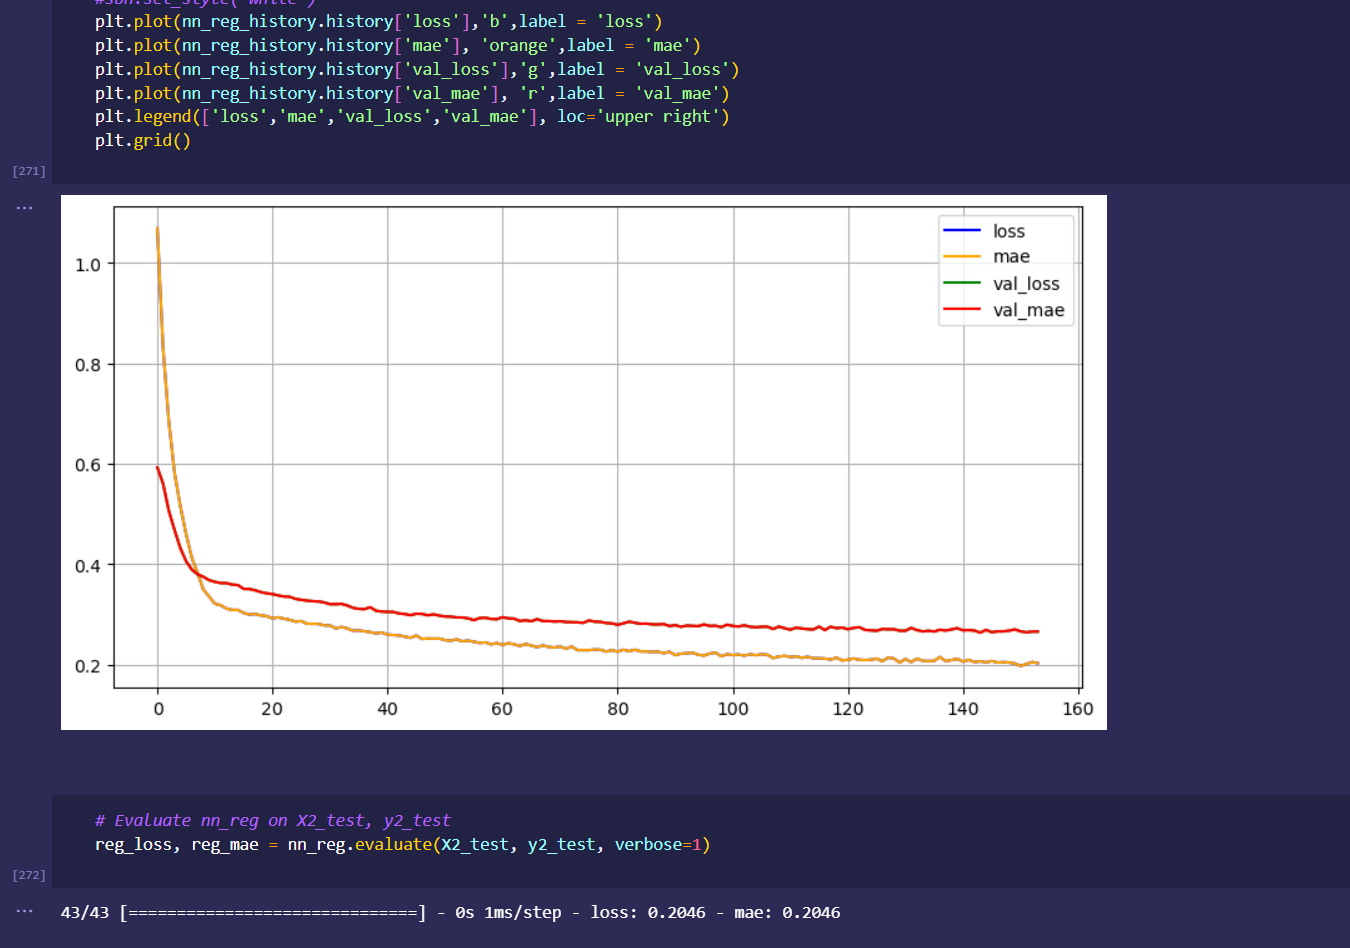
Graph of complex NN model training spanning over 154 epochs to minimize mean average error
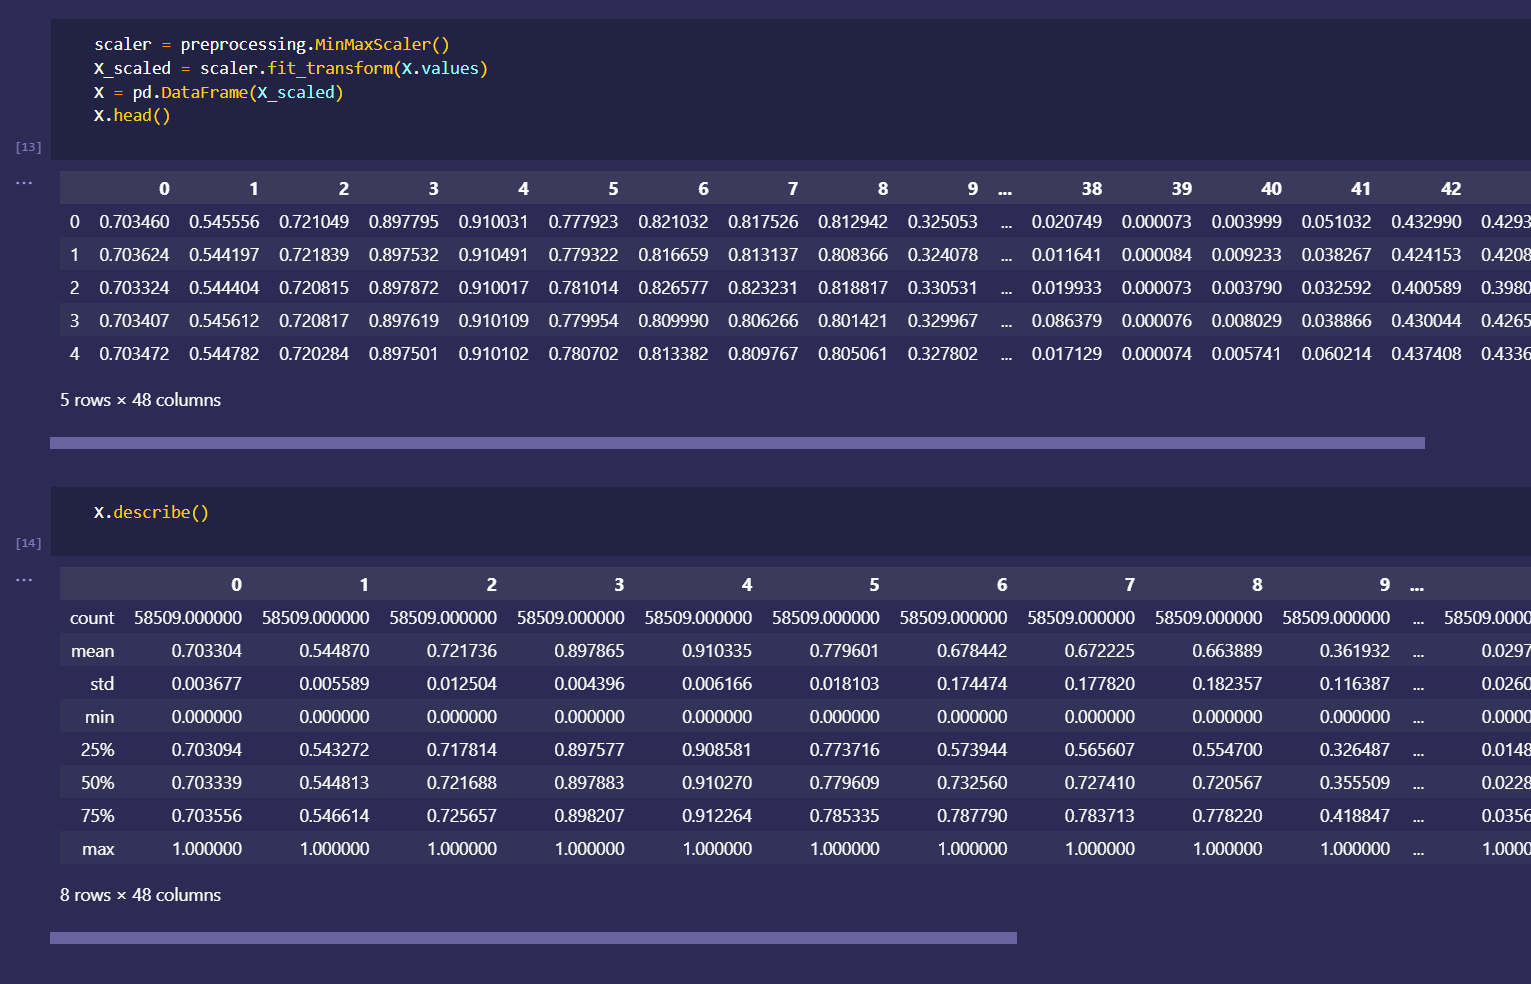
Preprocessing data and normalizing x features within 0-1 for better model prediction.
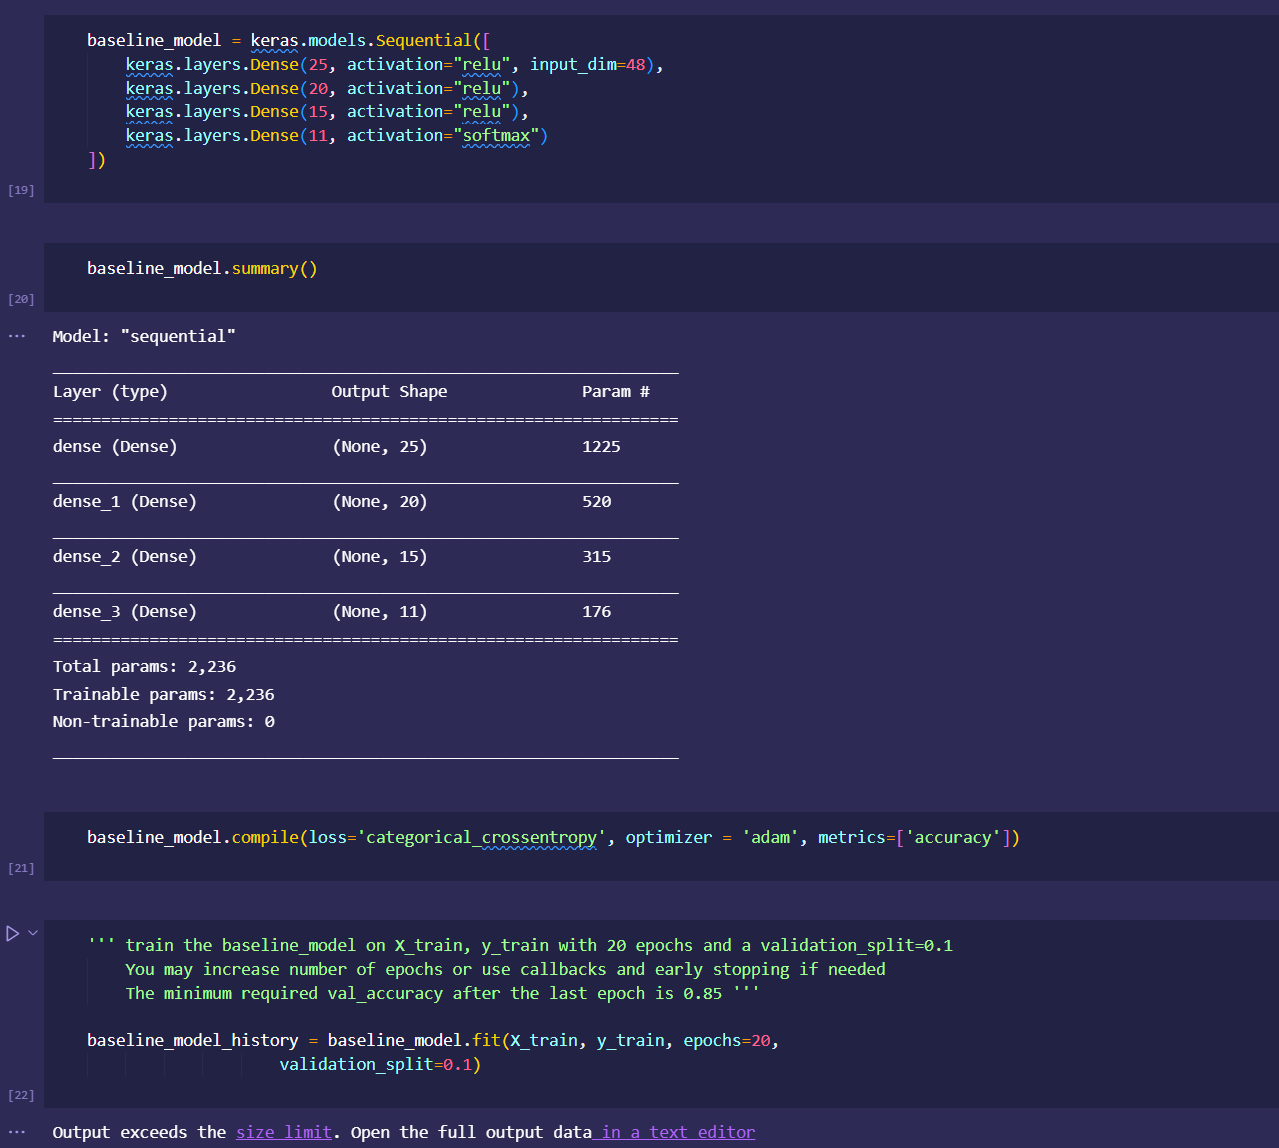
Constructing baseline neural network model and training for 20 epochs
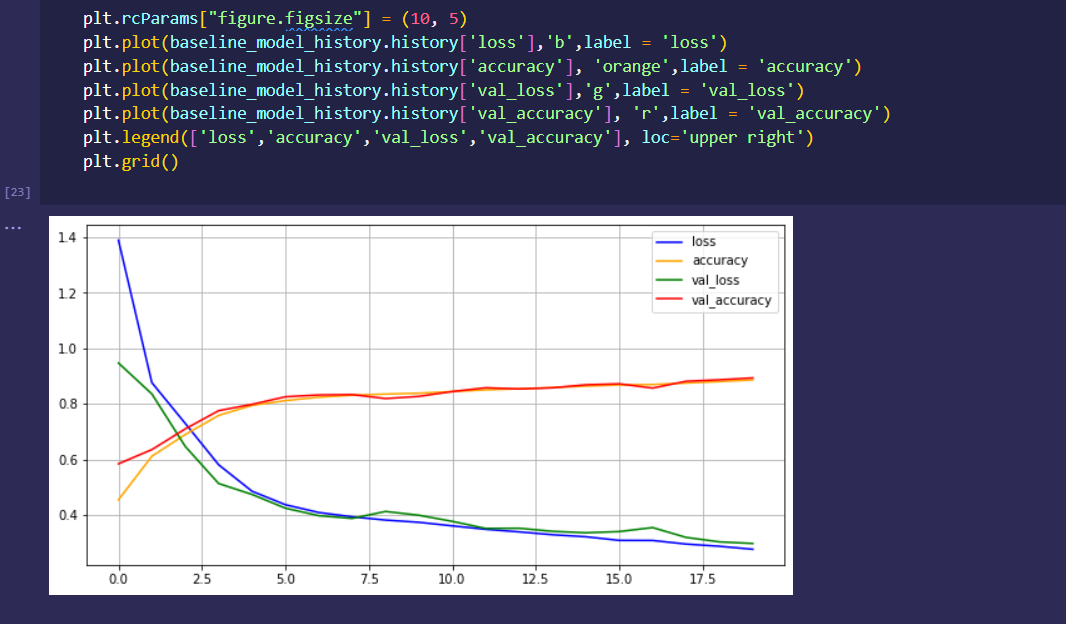
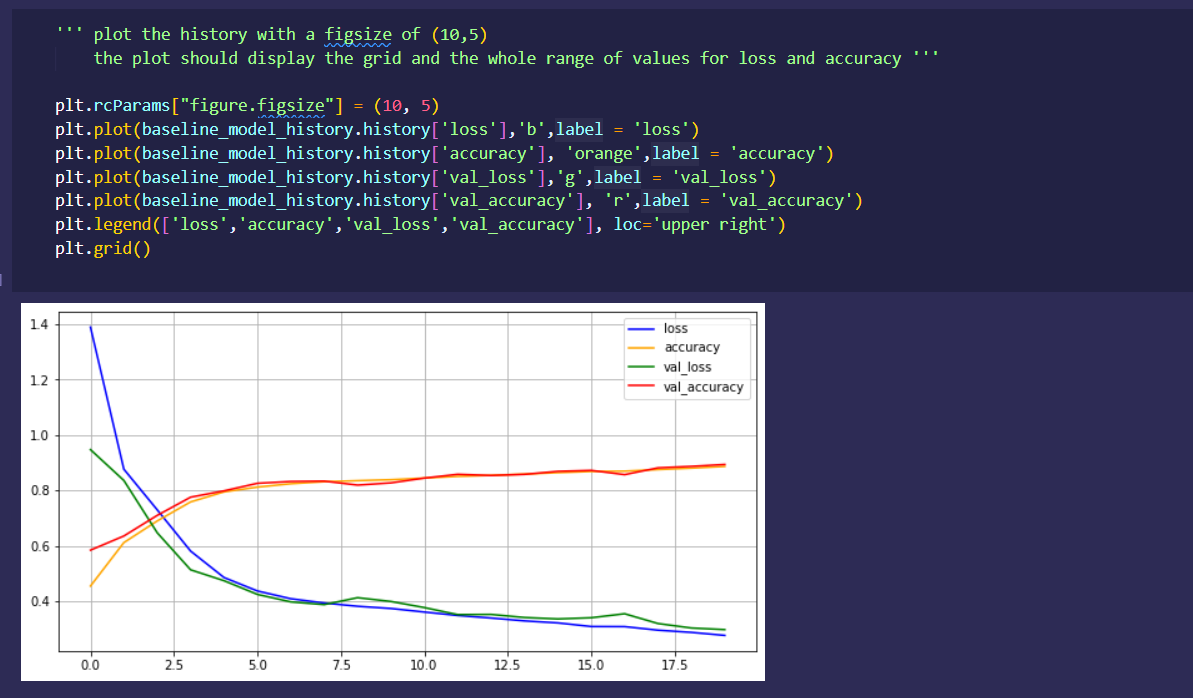
Graph of baseline model training over 20 epochs
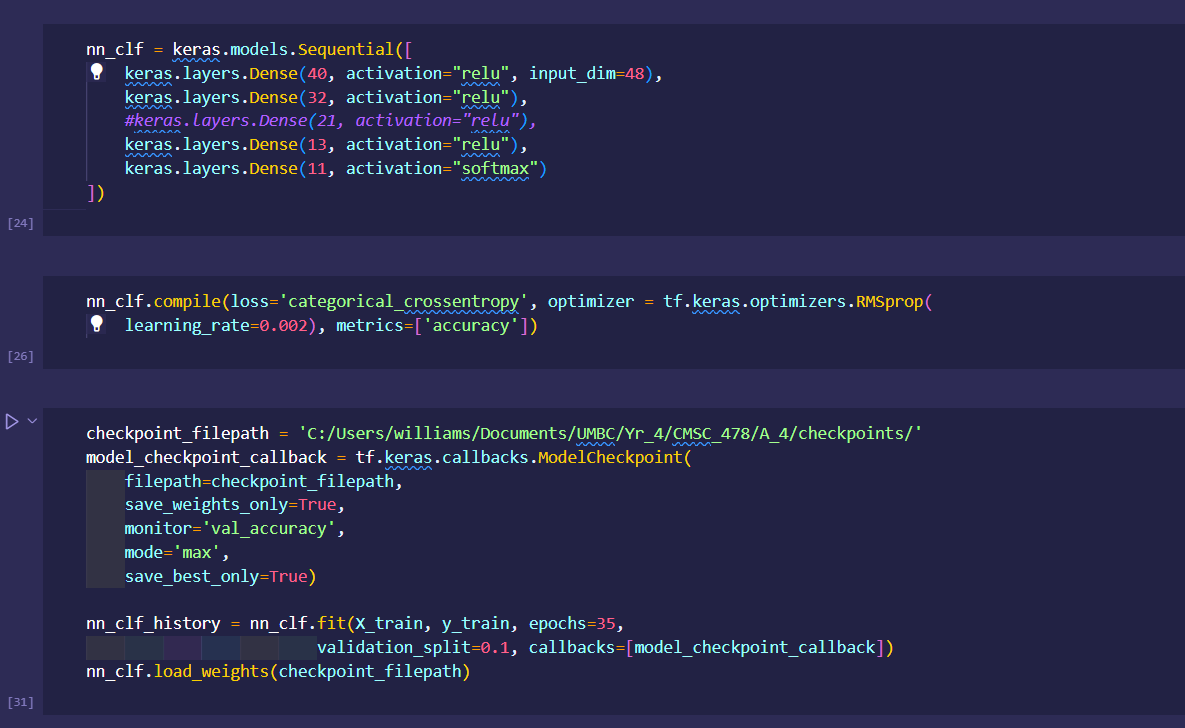
More complex neural network model made to achieve 99% accuracy
Graph of complex model training over 20 epochs
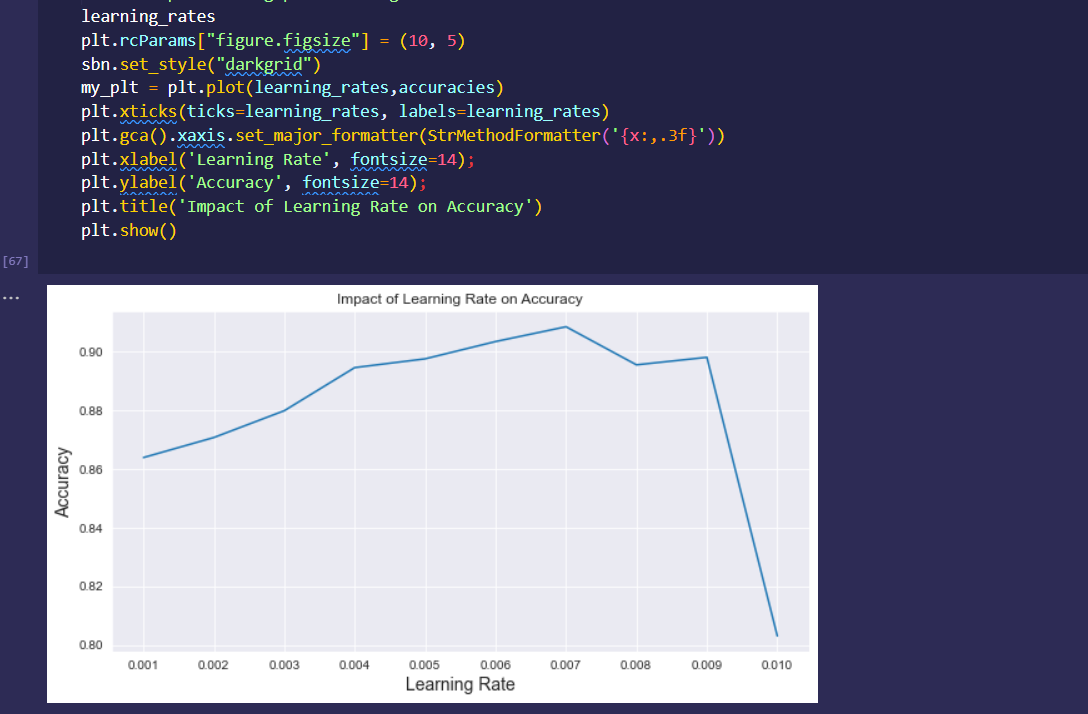
Graphing tests of various learning rates and its affect on performance and model accuracy
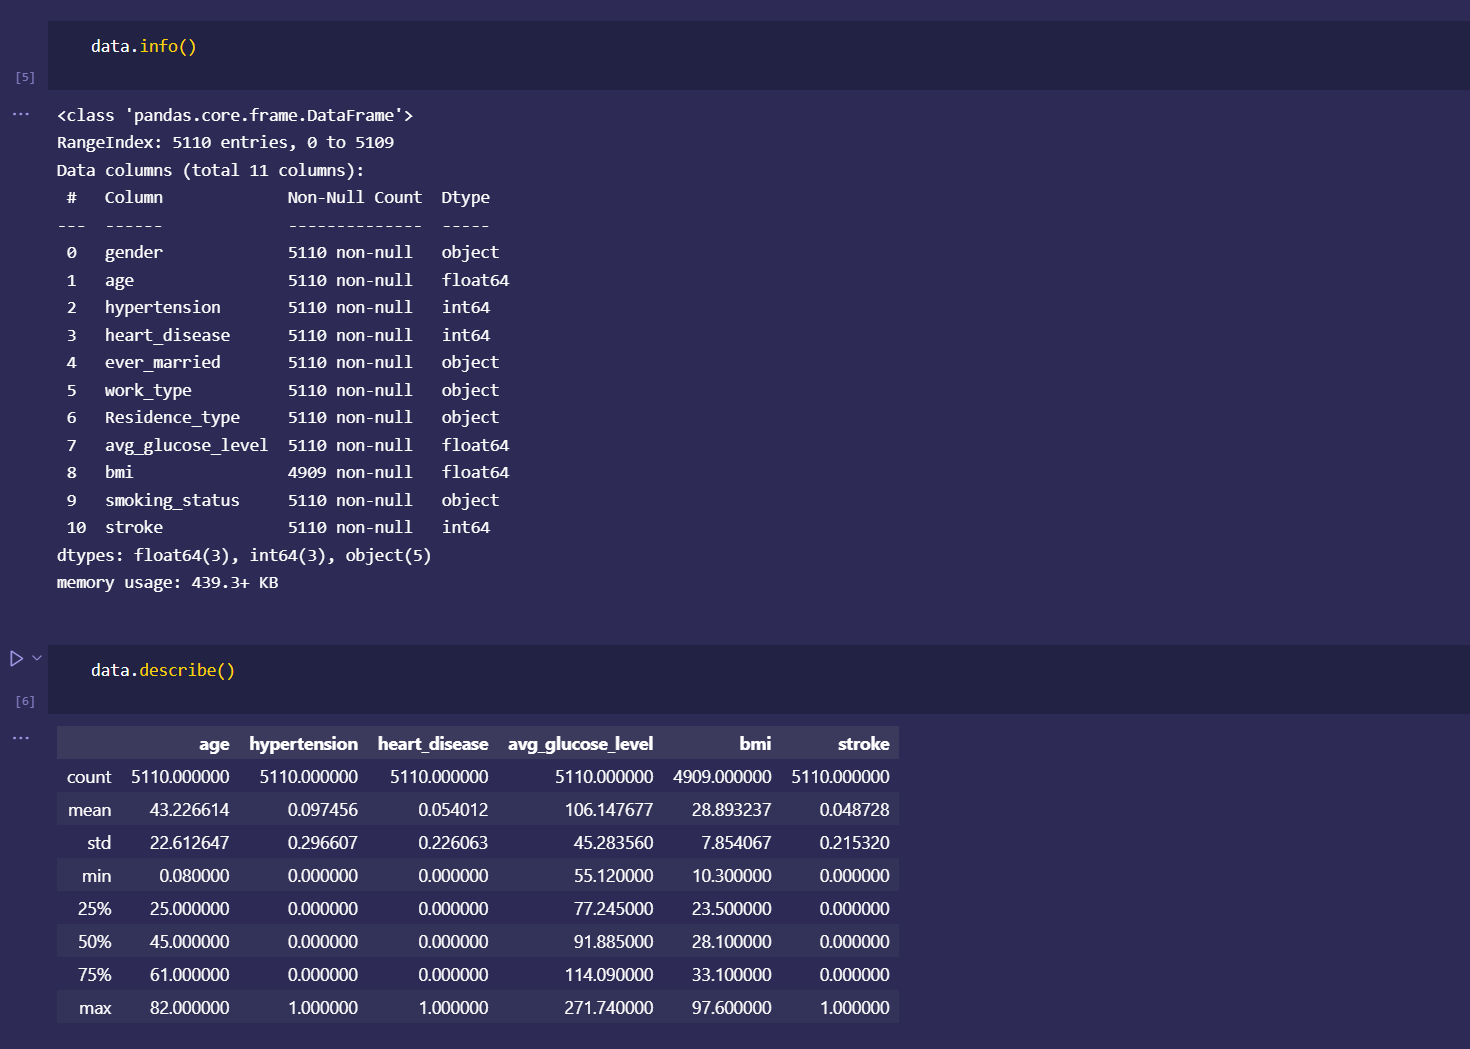
Preprocessing patients' stroke data (NA's dropped)
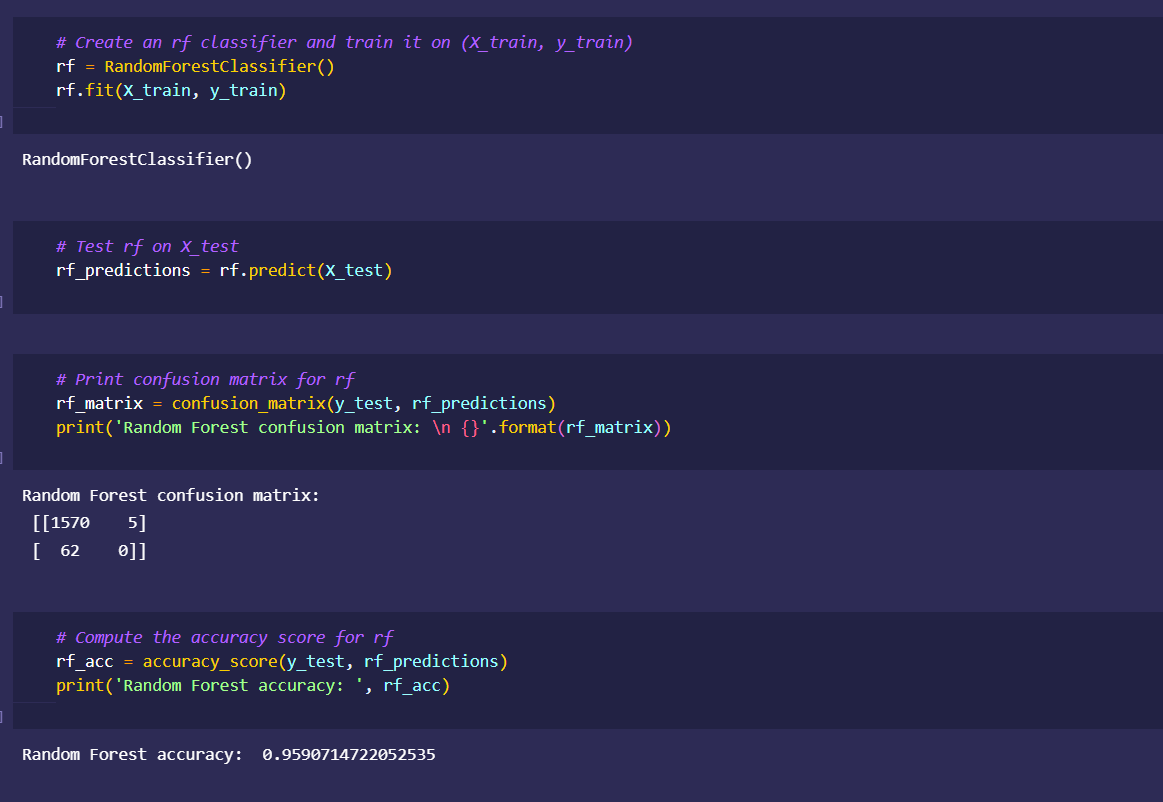
Using Scikitlearn's random forest classifier model and confusion matrix for testing afterwards
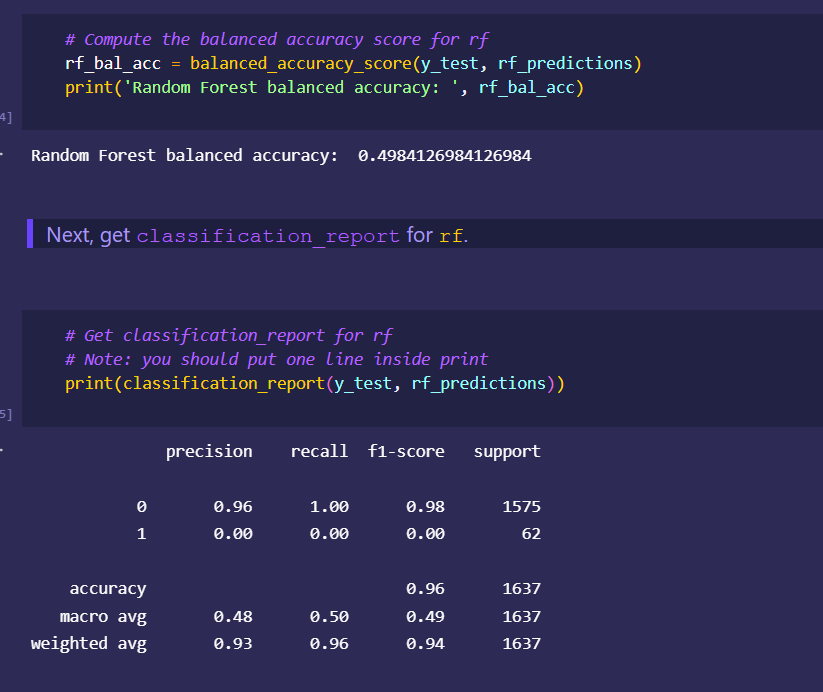
Looking at balanced accuracy afterwards for holistic accuracy
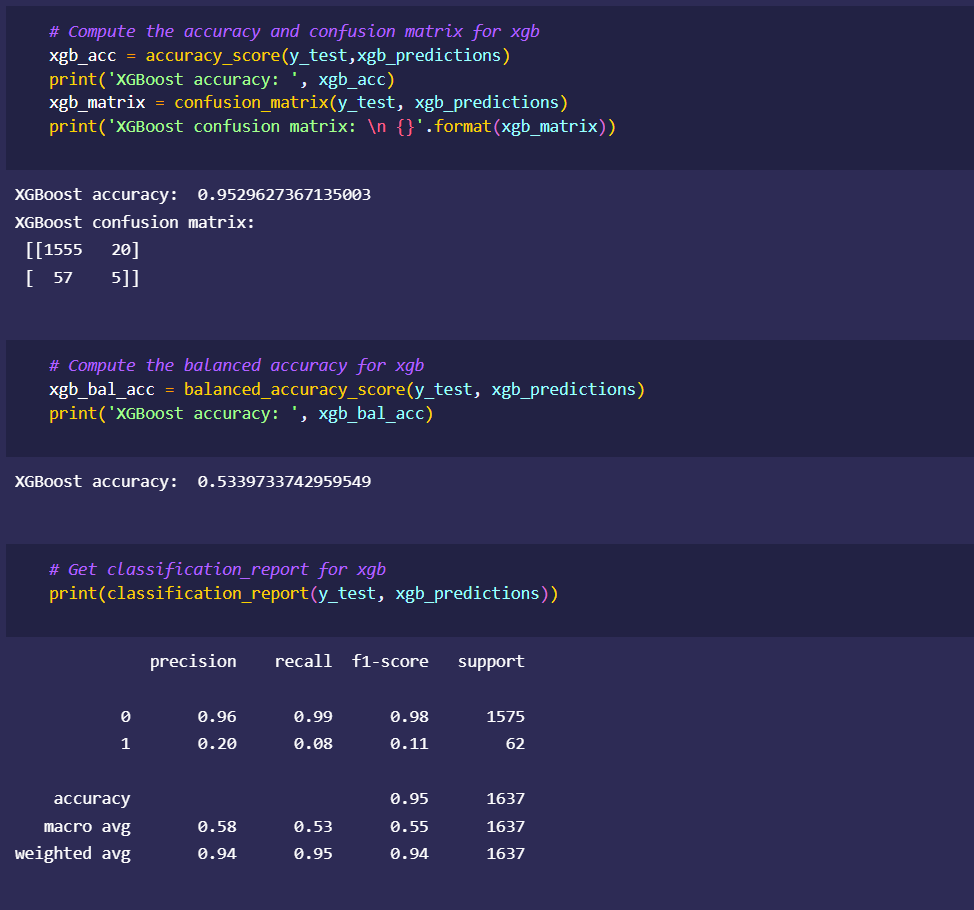
Using XGboost model to check for possible higher accuracy
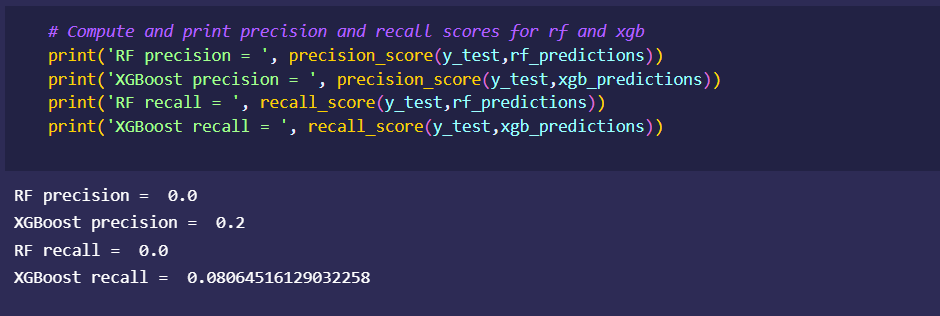
Comparison of both models
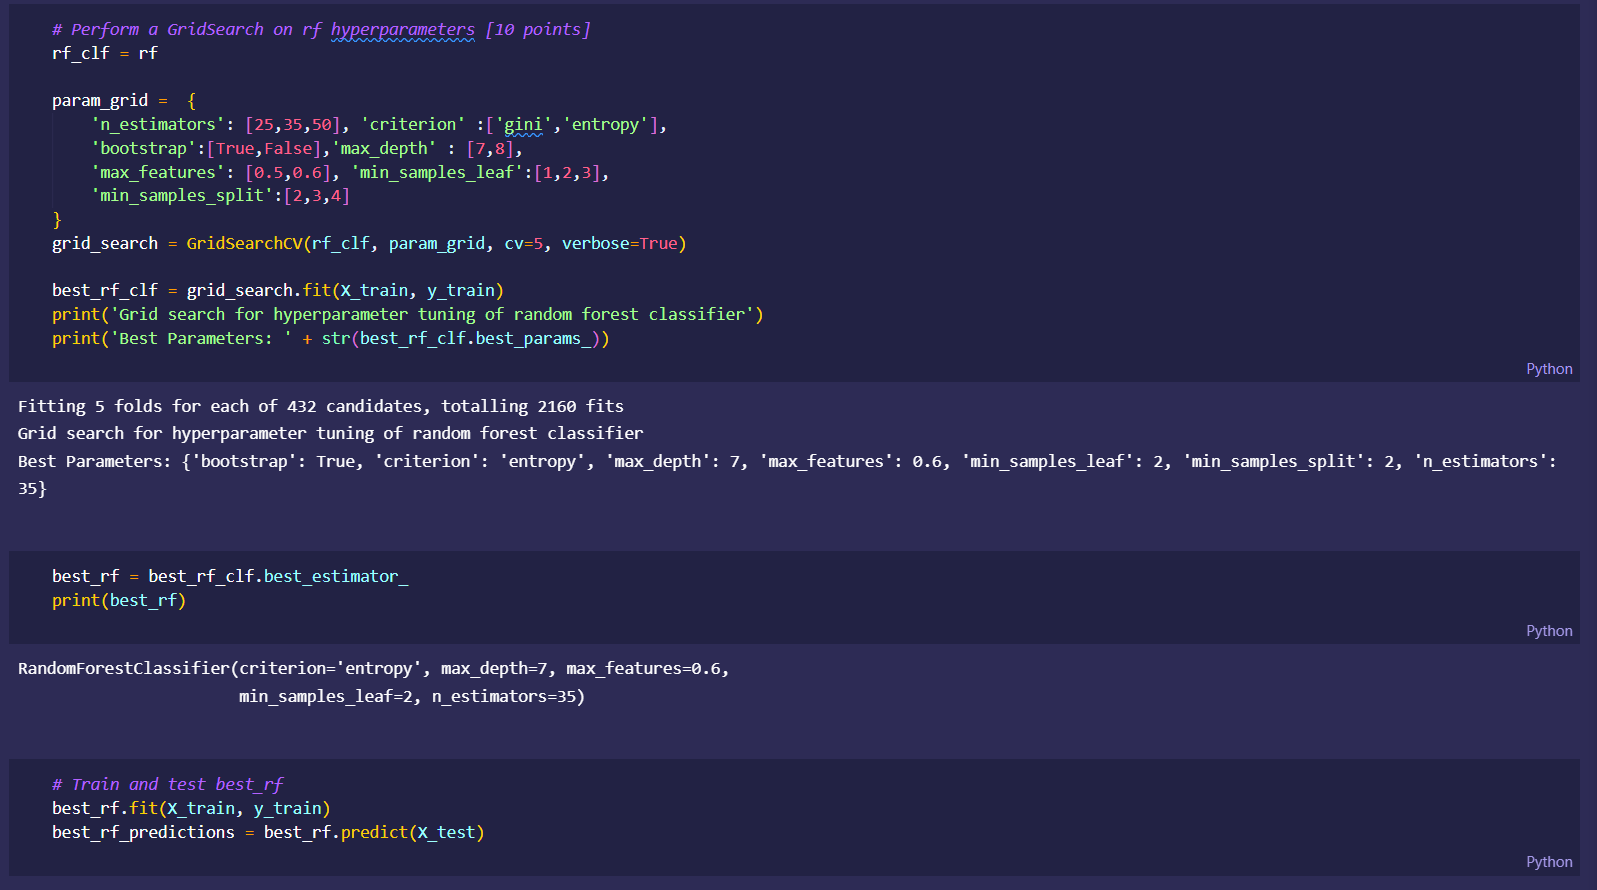
Grid search hyperparameter optimization of models
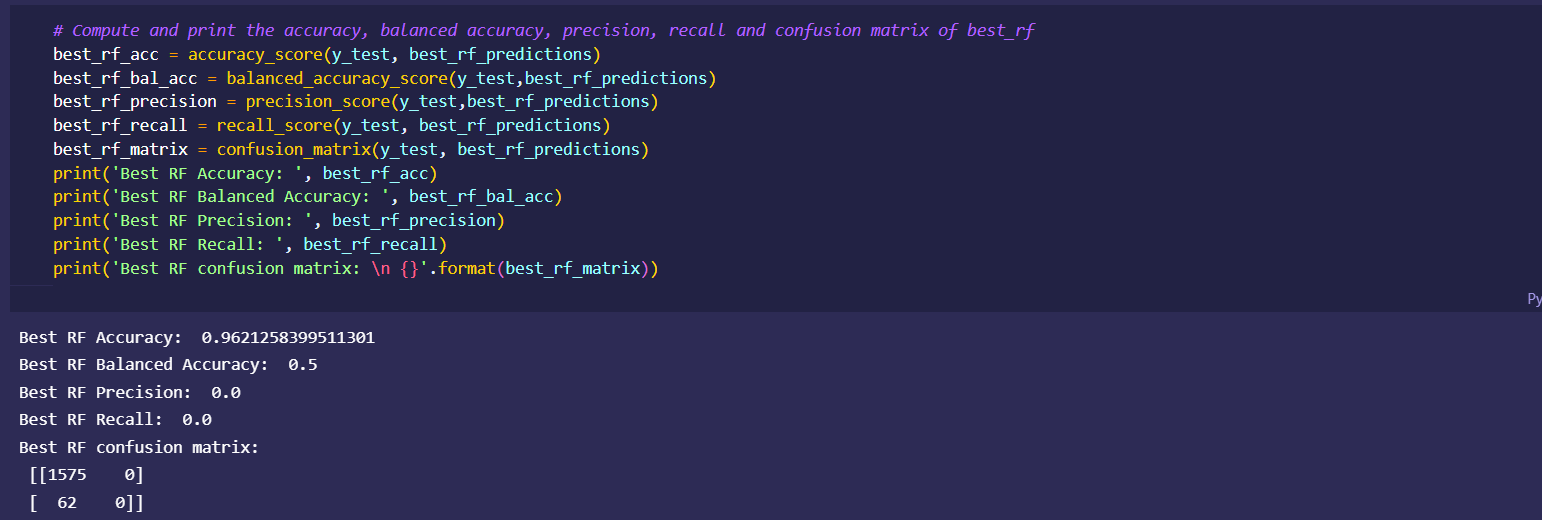
Comparison of both optimized models
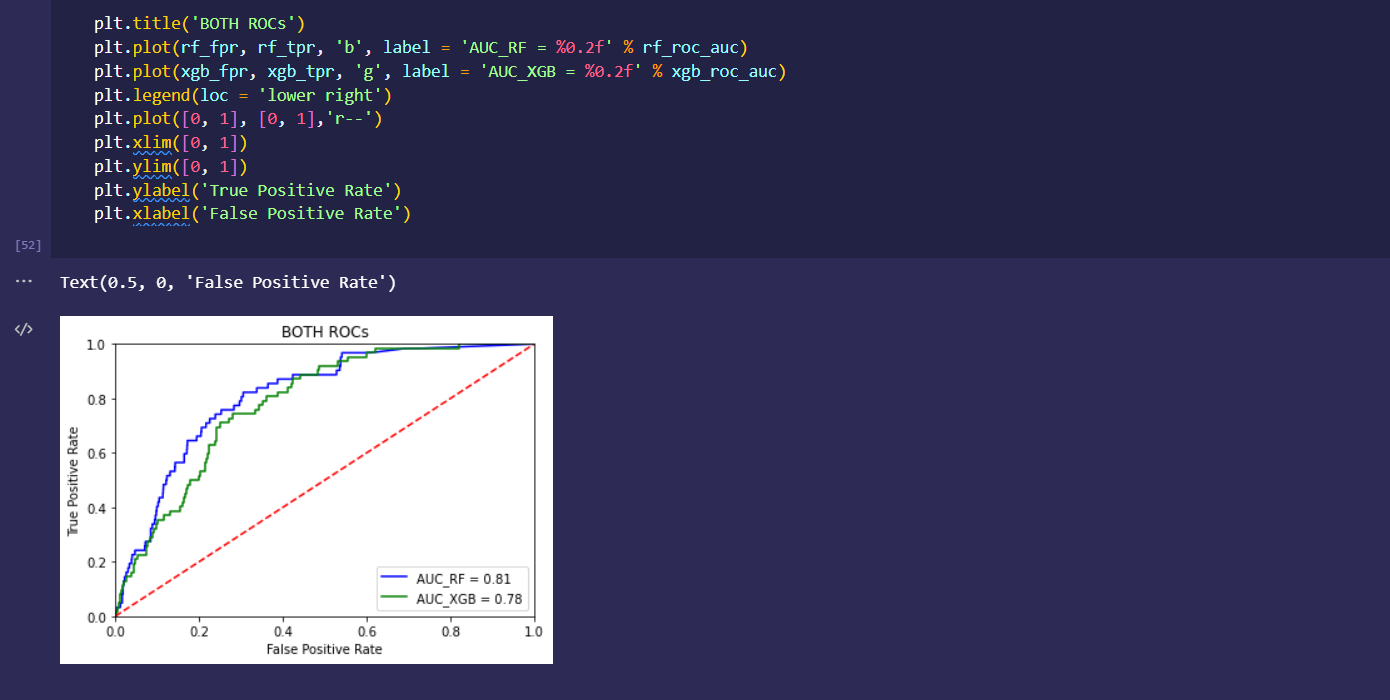
Both models ROC curves visualized
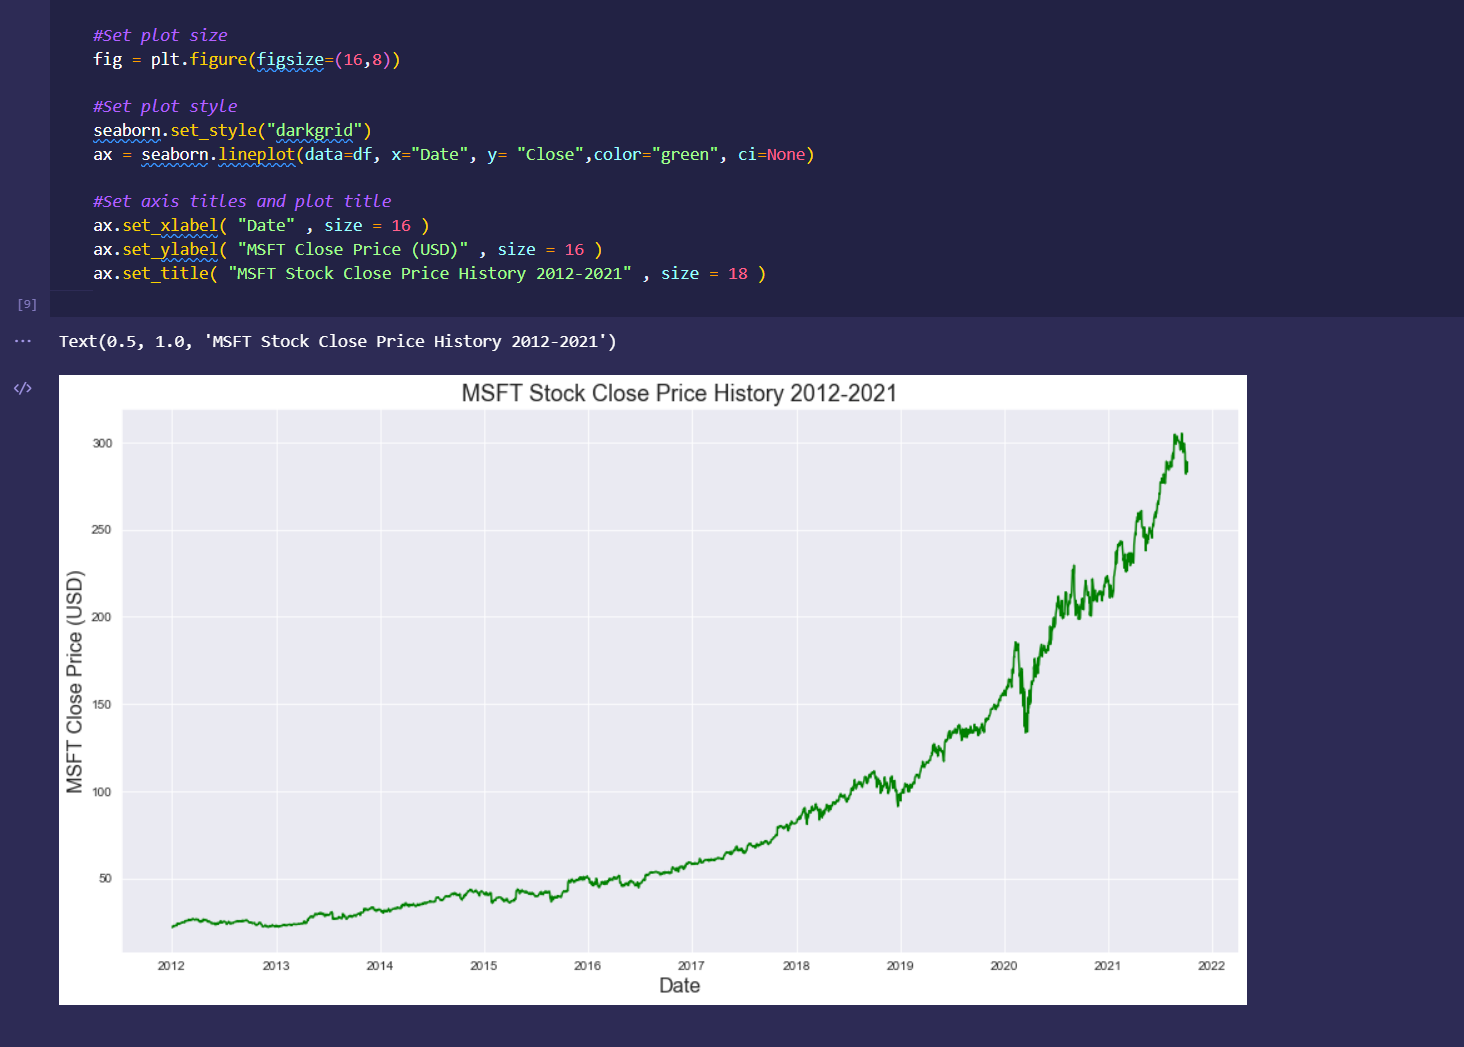
Graph of stock market data to be used for model development
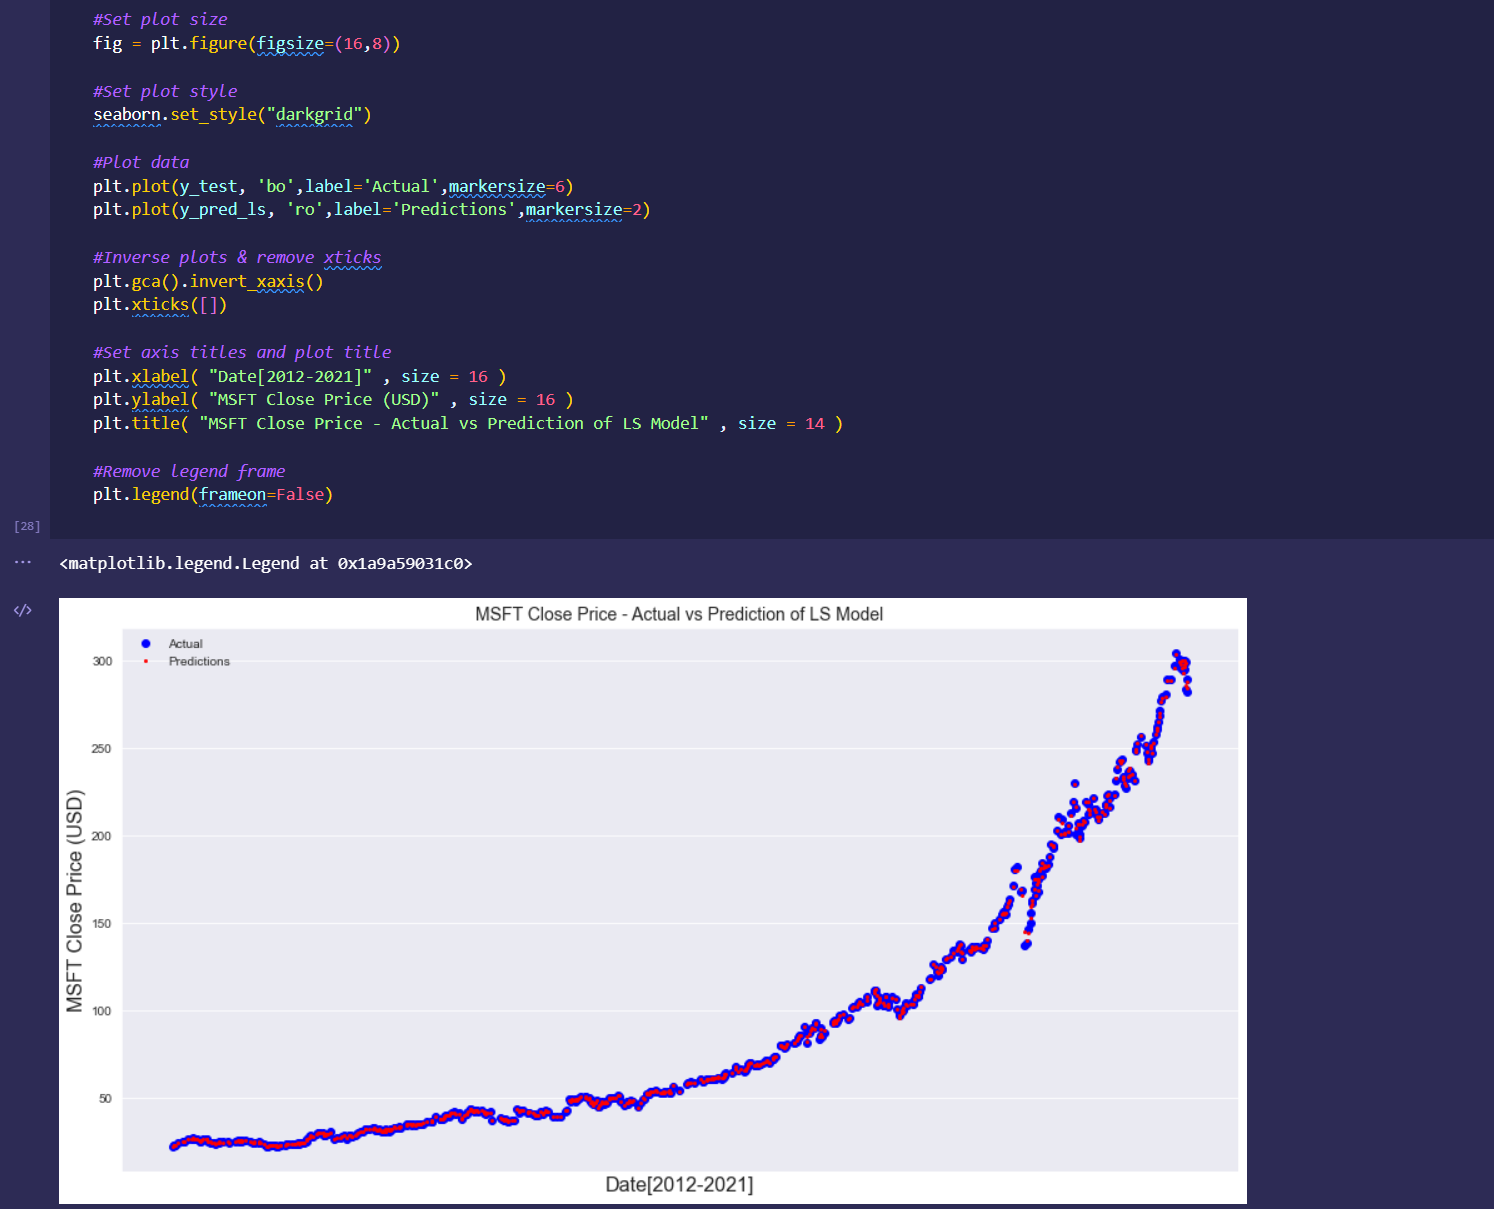
graphed Sci kit learn Linear regression model prediction against test data results
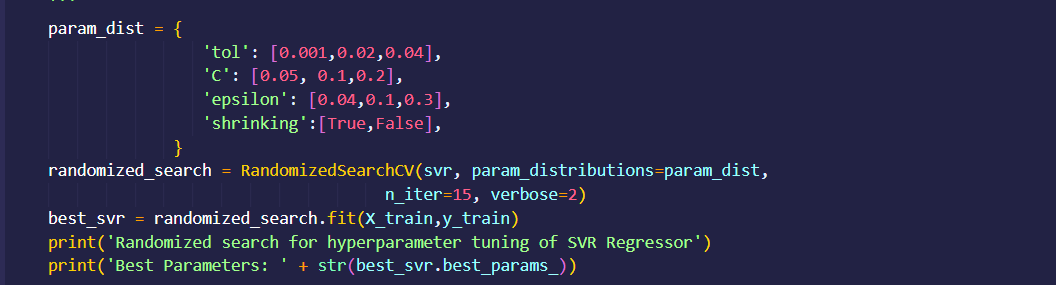
Hyperparameter Tuning
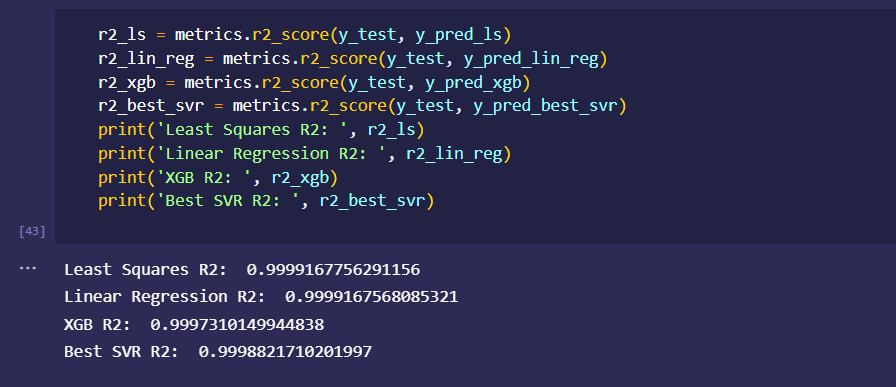
Comparison between different optimized models' accuracies